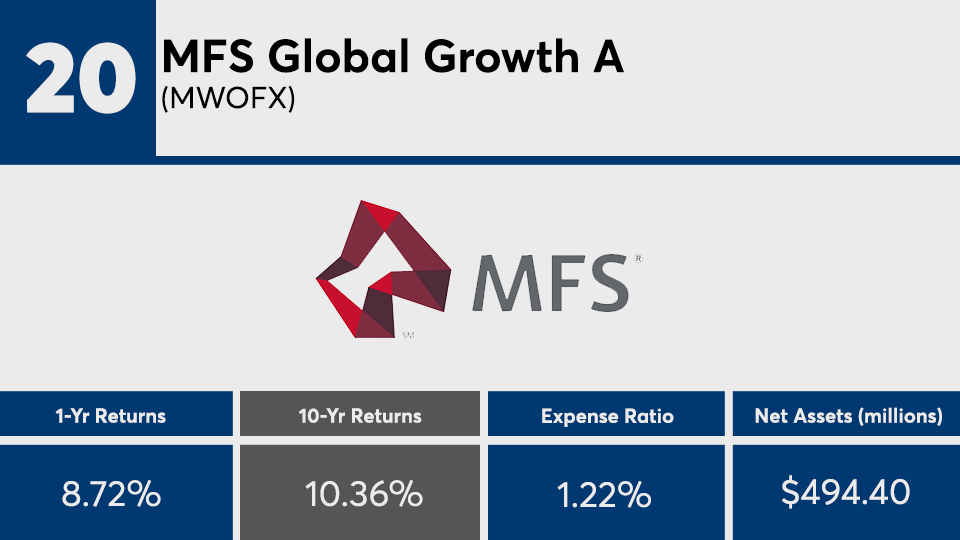
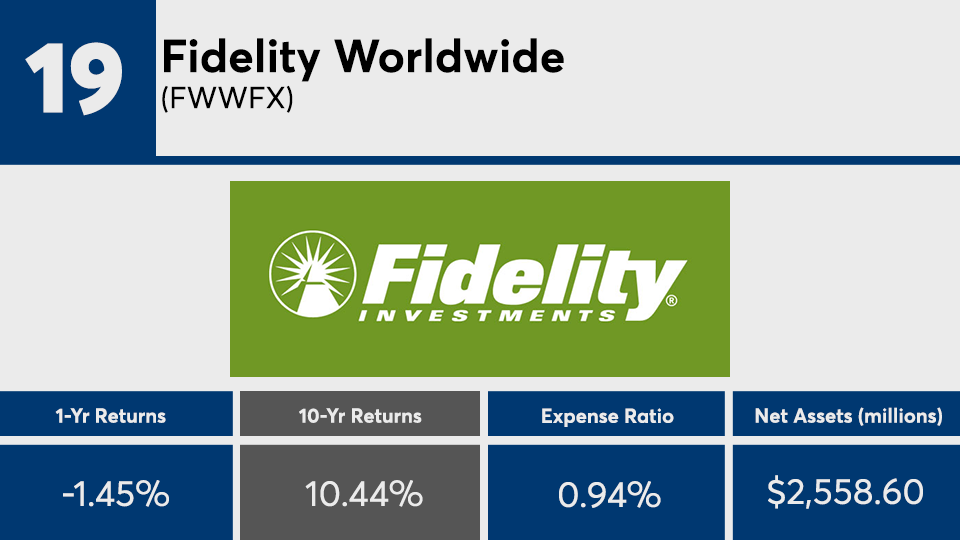
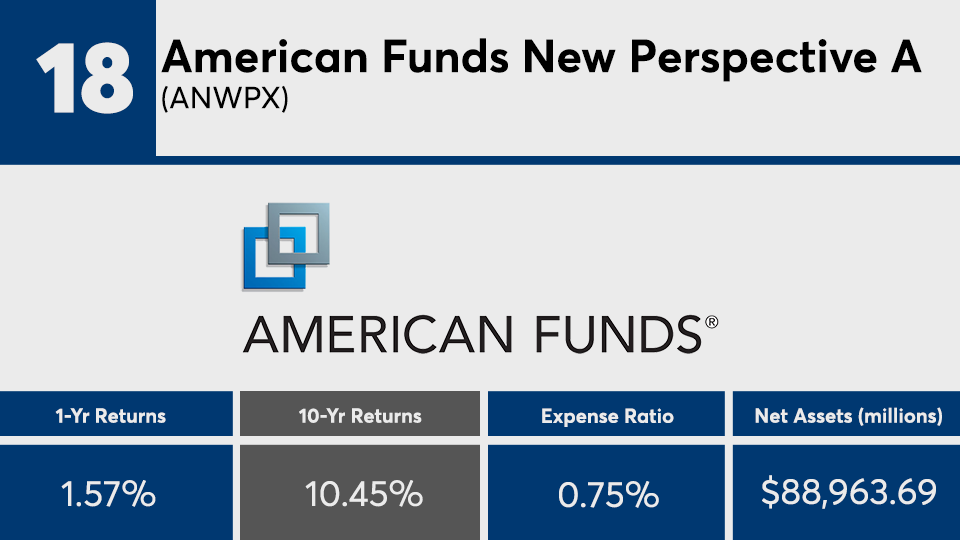
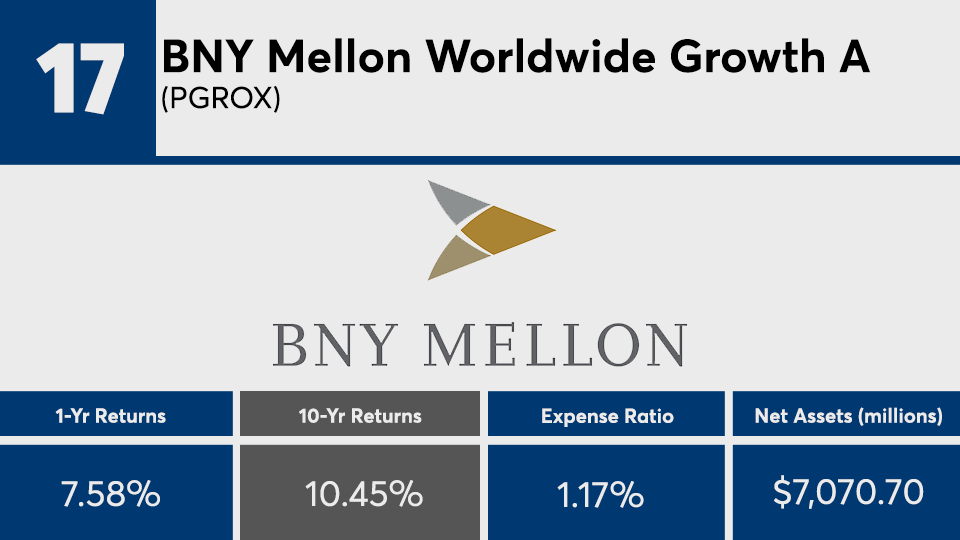
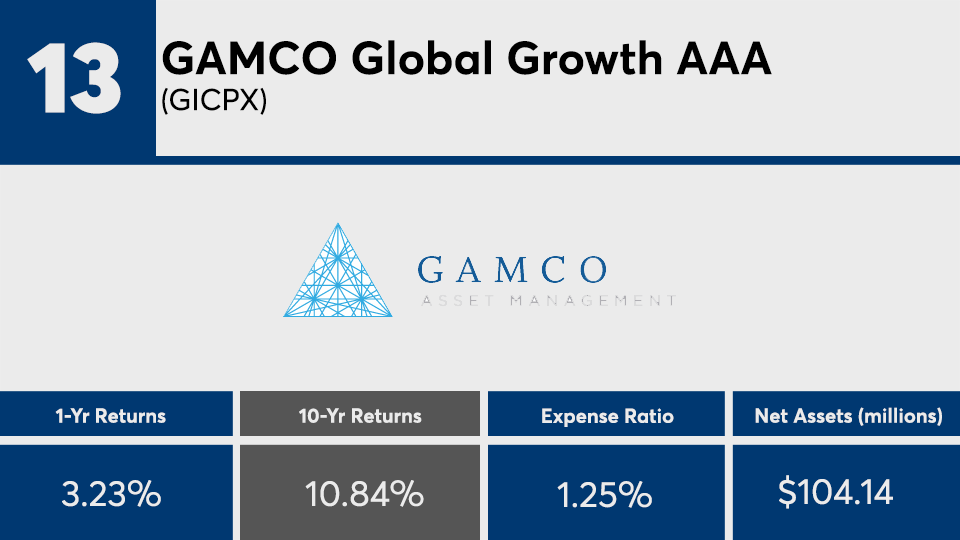
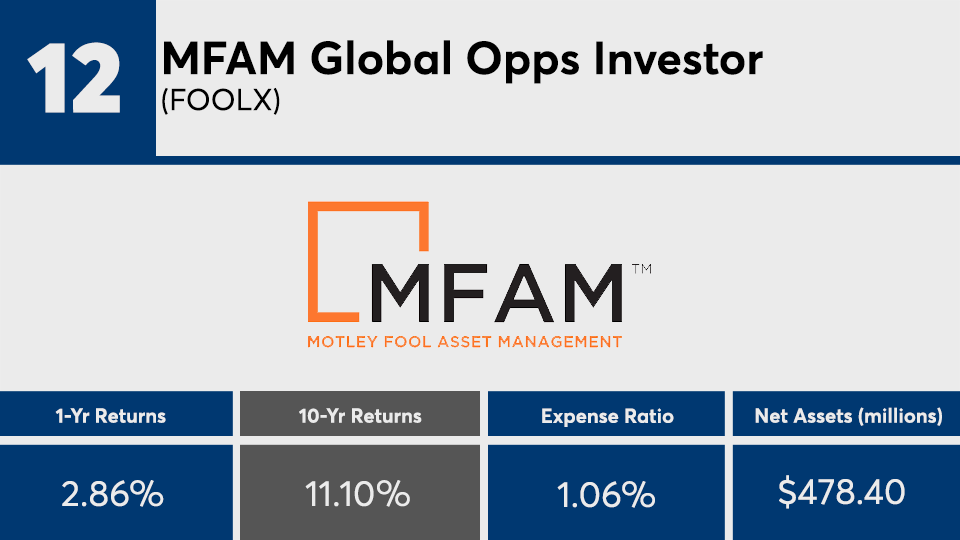
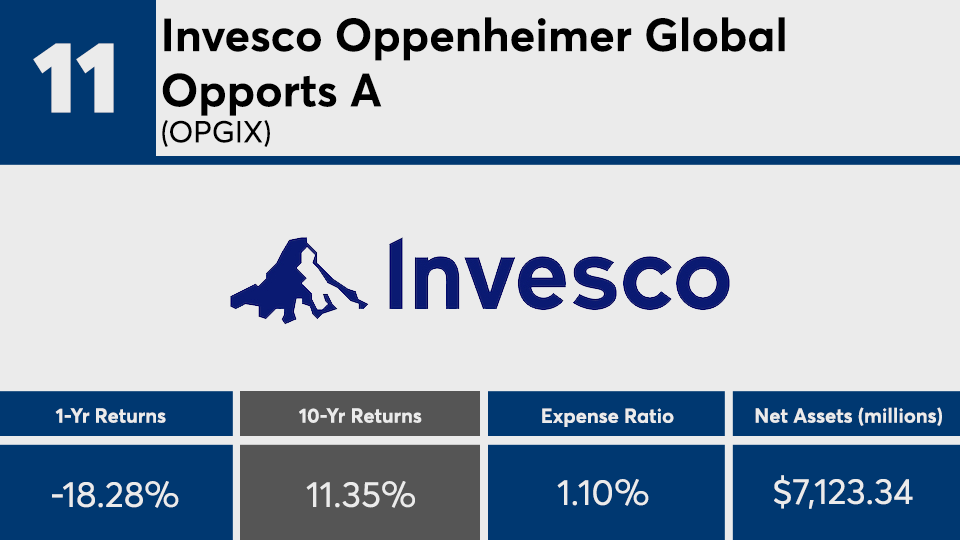
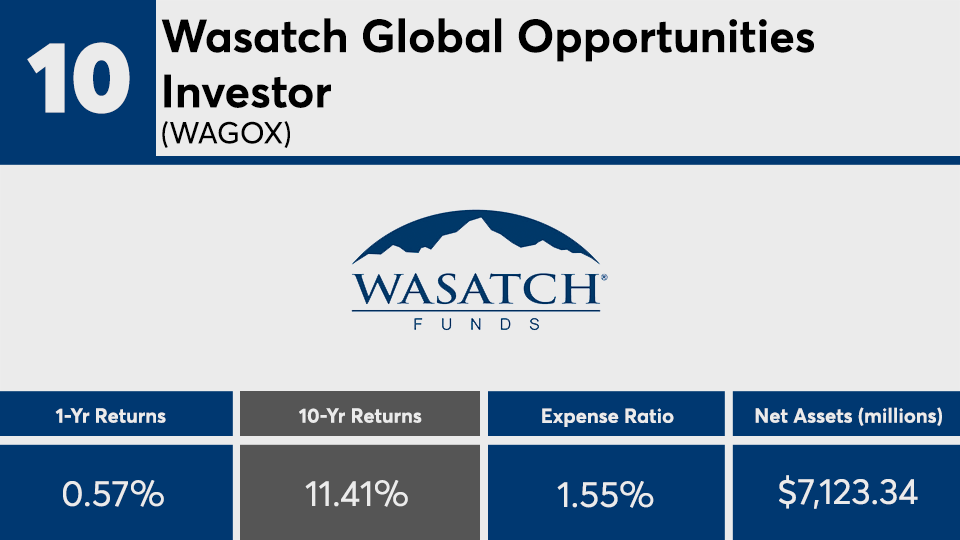
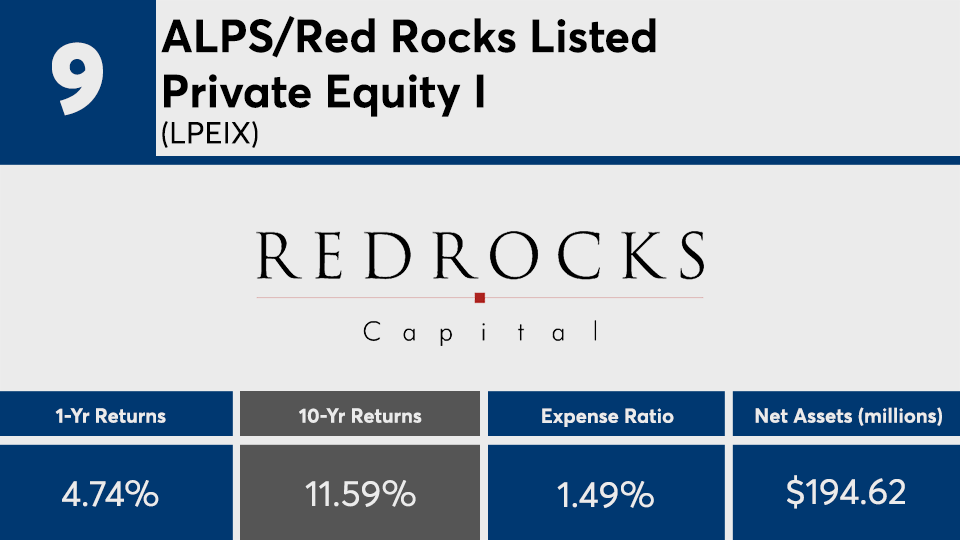
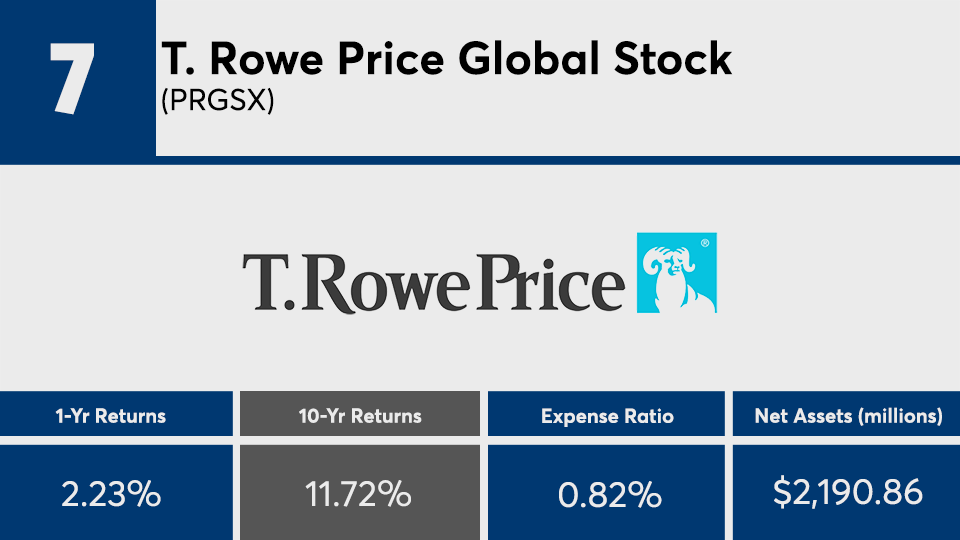
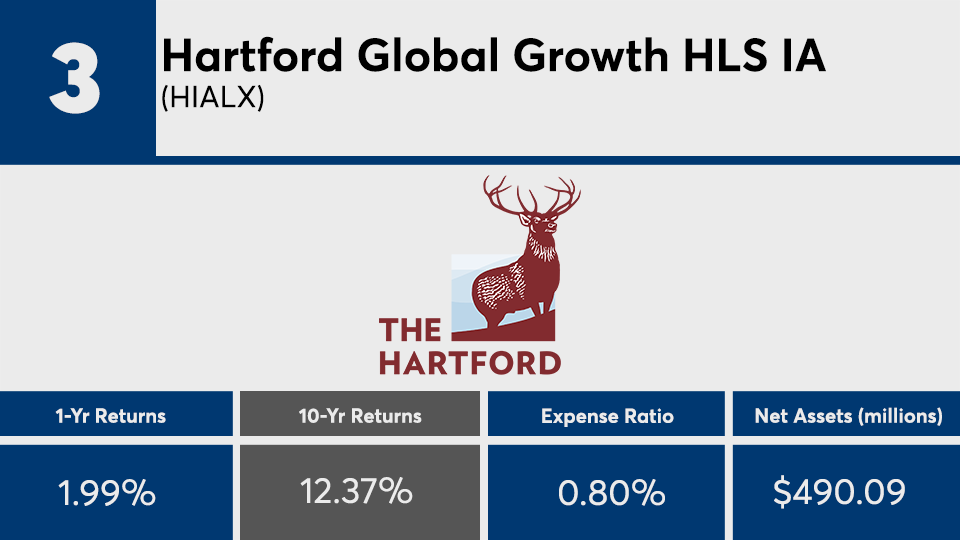
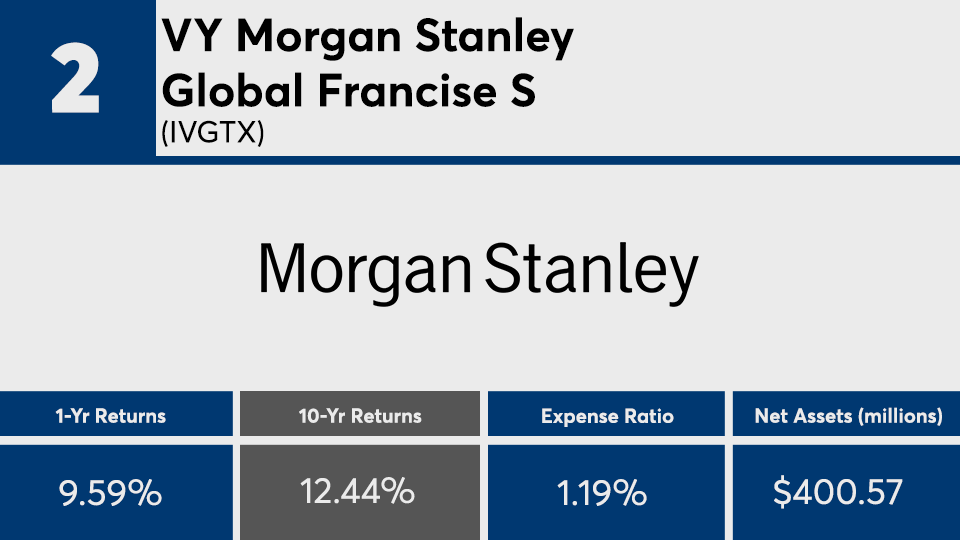
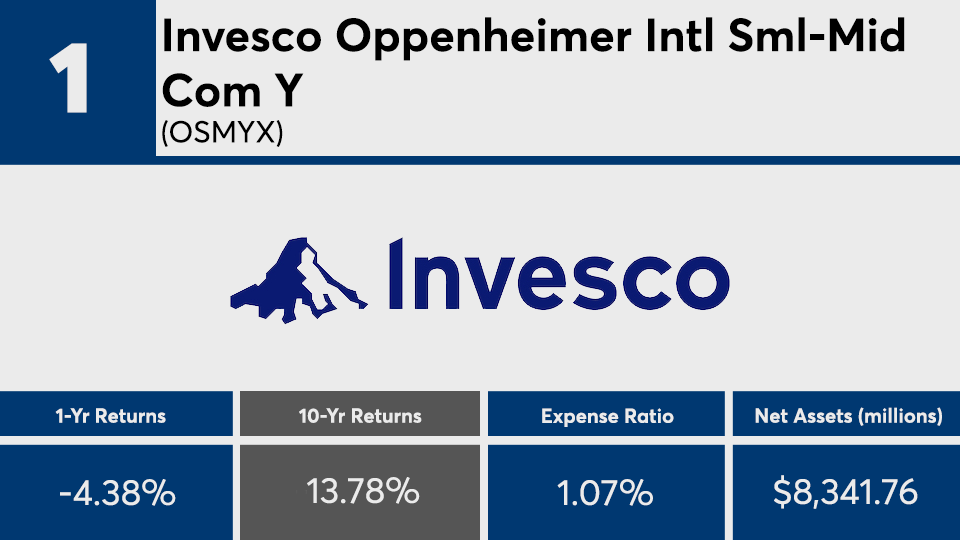
The top-performing international equity funds of the last 10 years posted an average gain of just under 11.5%, according to Morningstar Direct. That is roughly 3 percentage points lower than the Dow’s 13.46% gain, as tracked by the SPDR Dow Jones Industrial Average ETF (DIA), and the S&P 500’s 13.28% gain, as tracked by the SPDR S&P 500 ETF (SPY), over the same period.
While these high-cost international products may be volatile, they remain an important part of a diversified portfolio, says Greg McBride, chief financial analyst at Bankrate.
These funds provide “access to other growth opportunities while offsetting some of the risk of a U.S.-focused portfolio,” McBride says, adding that “because of the higher trading costs and less liquid markets, expect both index and active international funds to cost more than a similar U.S.-only fund.”
And cost more, they do. With an average net expense ratio of 1.17%, these funds more than twice as much as the 0.48% investors paid on average for fund investing last year, according to Morningstar’s most recent annual fee survey, which reviewed the asset-weighted average expense ratios of all U.S. open-end mutual funds and ETFs. For comparison, the industry’s largest fund, the Vanguard Total Stock Market Fund (VTSAX), has $813.5 billion in AUM, a 0.04% expense ratio and 13.18% annualized gain over the past 10 years.
“I’m not surprised (expense ratios) are a bit higher for these international equity funds, but there are some that are pretty high compared to their peers,” says Connor Young, an analyst on the manager research team focusing on equity strategies at Morningstar. “Lower fees broadly should be an indicator for long-term outperformance.”
Similar to VTSAX, which posted a significantly lower 2.42% gain over the last 12 months, the decade’s top-performing international funds also greatly underperformed this past year. With an average loss of 0.71%, these products are a prime example of why advisors typically stress portfolio diversity.
“There is a case to pay a little more in an asset class with broader opportunity like international and potential alpha to capture,” Young says. “Even in this last year, a lot of funds have benefited from tailwinds and that has served them well. But that may not be how the next 10 years looks.”
Scroll through to see the 20 top-performing international equity funds (with at least $100 million in assets under management) ranked by 10-year annualized returns through Sept. 27. Funds with investment minimums over $100,000 were excluded, as were leveraged and institutional funds. Assets and expense ratios for each, as well as one-year daily returns, are also listed. The data shows each fund's primary share class. All data from Morningstar Direct.
