List

FP50 2018: Which IBDs have the most producing reps?

Wealth management executives from firms with limited advisor head counts like to point out that a large representative force doesn’t necessarily translate into massive revenue.

While this is true for many firms, the independent broker-dealer with nearly double the number of producing representatives of any other firm, LPL Financial, has also generated more revenue than any other IBD for at least the past 17 years.

However, the list of the top 10 IBDs ranked by the number of producing reps includes three firms from outside the group of the 10 firms with the highest revenues in the IBD space, according to figures disclosed for Financial Planning’s annual FP50 study. All firms besides LPL have different spots on the two lists, as well.

One firm’s absence from the top 10 largest head counts also stands out. Commonwealth Financial Network, which reported far and away the highest average payout of $512,000 per advisor and the fourth-highest revenue at $1.2 billion, reported only the 14th highest number of producing reps at 1,778.

Other firms have a long way to go to match Commonwealth in productivity, but many are trying to narrow the gap by shedding lower producers and investing in organic growth.

Five of the top 10 firms by producing reps were also among the 10 IBDs reporting the highest number of dropped reps. And MassMutual’s MML Investors Services, Northwestern Mutual and HD Vest Financial Services made both those lists, along with the top 10 firms ranked by payout growth in 2017.

Firms’ head counts, then, show how they’re responding to a challenging time in which experts predict the overall number of advisors to fall in coming years across wealth management’s current crop of some 300,000. The IBD space has yet to fall completely in line with that narrative, though.

In fact, the number of producing reps disclosed by firms has increased 9% over the past five years to 92,834, roughly 7,500 additional producing reps. In the same span, though, the number of registered reps, a more inclusive figure including back-office reps, has fallen 8% to 112,141.

The data on firms’ head counts come from the end of 2017. To see how firms stack up based on their number of producing reps, scroll through the slideshow. For a list of the top 25 firms based on revenue, click here. And for a full recap of 2017 in the IBD space, see FP50: IBDs Adapt to Survive.

FP502018_Reps_No10 copy.png

10. Cetera Advisor Networks

Producing reps: 2,586
% change year-over-year: 3.9%
Producing reps rank: #10
Average payout: Not provided
2017 revenue: $606,849,000
FP50 rank: #10
FP502018_Reps_No9 copy.png

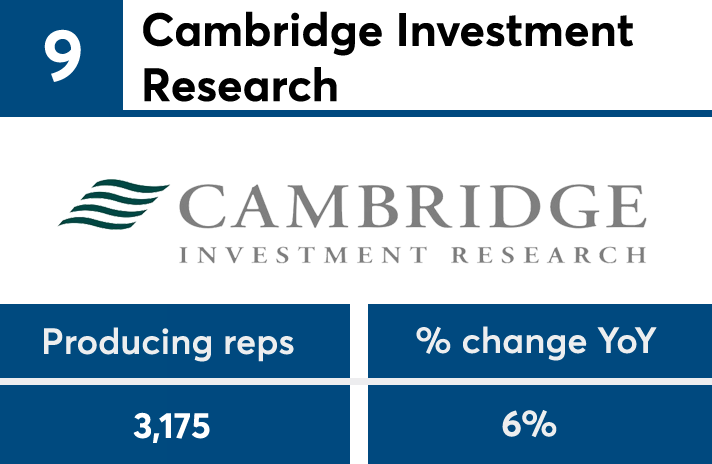
9. Cambridge Investment Research

Producing reps: 3,175
% change year-over-year: 5.7%
Producing reps rank: #9
Average payout: $256,000
2017 revenue: $811,396,000
FP50 rank: #7
FP502018_Reps_No8 copy.png

8. Transamerica Financial Advisors

Producing reps: 3,241
% change year-over-year: 1.8%
Producing reps rank: #8
Average payout: $22,000
2017 revenue: $93,818,000
FP50 rank: #45
FP502018_Reps_No7 copy.png

7. HD Vest Financial Services

Producing reps: 4,000
% change year-over-year: (10.7%)
Producing reps rank: #7
Average payout: $59,000
2017 revenue: $348,620,000
FP50 rank: #19
FP502018_Reps_No6 copy.png

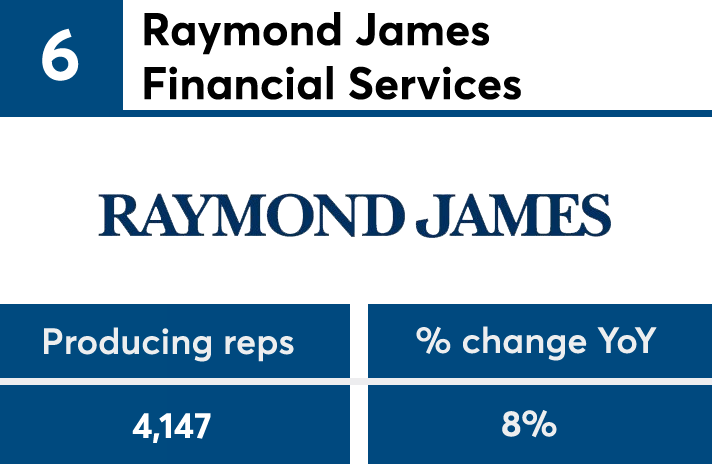
6. Raymond James Financial Services

Producing reps: 4,147
% change year-over-year: 8.4%
Producing reps rank: #6
Average payout: $349,000
2017 revenue: $2,071,244,000
FP50 rank: #3
FP502018_Reps_No5 copy.png

5. AXA Advisors

Producing reps: 4,326
% change year-over-year: (1.1%)
Producing reps rank: #5
Average payout: $93,000
2017 revenue: $786,527,000
FP50 rank: #8
FP502018_Reps_No4 copy.png

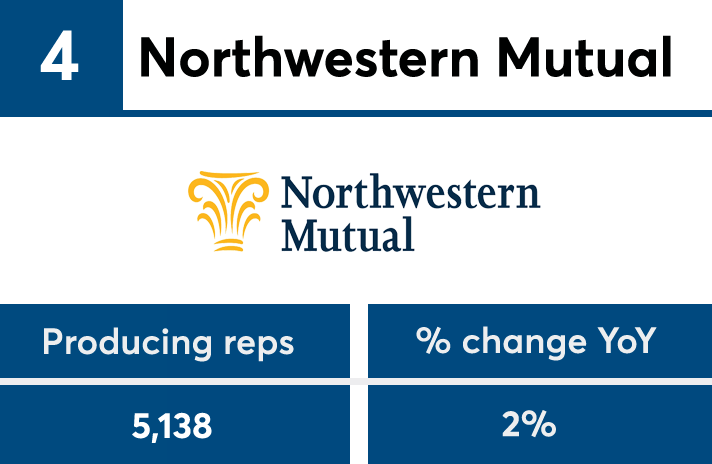
4. Northwestern Mutual

Producing reps: 5,138
% change year-over-year: 2.0%
Producing reps rank: #4
Average payout: $134,000
2017 revenue: $945,412,000
FP50 rank: #6
FP502018_Reps_No3 copy.png

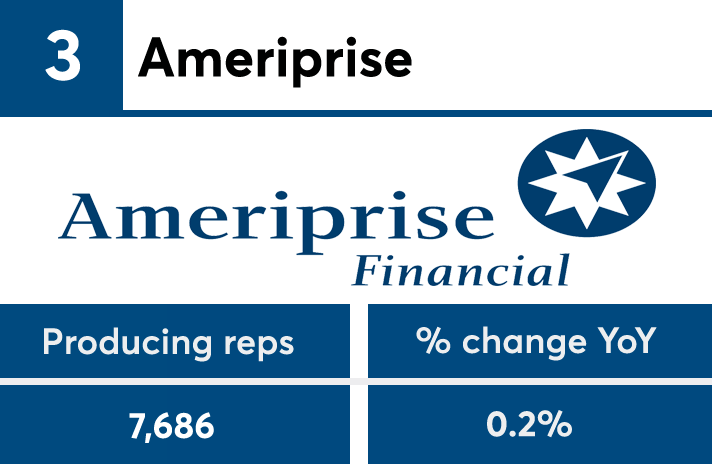
3. Ameriprise

Producing reps: 7,686
% change year-over-year: 0.2%
Producing reps rank: #3
Average payout: Not provided
2017 revenue: $4,259,992,000
FP50 rank: #2
FP502018_Reps_No2 copy.png

2. MML Investors Services

Producing reps: 8,628
% change year-over-year: 130.9%
Producing reps rank: #2
Average payout: $76,000
2017 revenue: $1,050,377,000
FP50 rank: #5
FP502018_Reps_No1 copy.png

1. LPL Financial

Producing reps: 15,210
% change year-over-year: 5.8%
Producing reps rank: #1
Average payout: $176,000
2017 revenue: $4,281,481,000
FP50 rank: #1
MORE FROM FINANCIAL PLANNING