Want unlimited access to top ideas and insights?
Does highest cost mean highest return?
Sort of. An analysis of the largest 10-year gains from some of the industry’s highest-priced funds show they managed to give some bang for the buck, albeit at a price to the investor.
The top 20 performers of the decade with net expense ratios over 1% — and with at least $500 million in assets under management — edged out the major benchmarks with an average gain of 14.80%, Morningstar Direct data show. They carried an average expense ratio, however, above 115 basis points.
By comparison, the Dow has posted a gain of 10.40% over the past decade, as measured by the SPDR Dow Jones Industrial Average ETF Tracker (DIA). The S&P managed a gain of 11.02%, as measured by SPDR S&P 500 ETF Trust (SPY), over the same period. And the Bloomberg Barclays US Aggregate Bond Index recorded a 10-year return of 3.95%, as measured by the iShares Core US Aggregate Bond ETF (AGG), data show.
“Overall, expense ratios have gone down in just about every sector,” notes Marc Pfeffer, CIO of CLS Investments, adding that clients can also find these gains if they “buy passive funds for virtually nothing. Sometimes that works out and sometimes it doesn’t.”
The top-performers analyzed here, all of which are mutual funds, carry an average net expense ratio of 1.16% — placing them well above the broader industry’s average of 0.48%, according to Morningstar’s most recent annual fee survey, which reviewed the asset-weighted average expense ratios of all U.S. open-end mutual funds and ETFs.
The industry’s largest funds were far cheaper. With a 0.04% expense ratio, the $736.7 billion Vanguard Total Stock Market Index Fund (VTSAX) posted a 10-year gain of 10.66%. The $259.3 billion Vanguard Total Bond Market Index Fund (VBTLX) — the industry’s largest overall fixed-income fund — has a 0.50% expense ratio and notched a 10-year gain of 4%.
“If your clients are invested in the right funds, and more importantly the right sectors, you have done well, even if management fees are high,” Pfeffer says. “The asset allocation is more important than the expense ratio. However, that doesn’t mean you should ignore any single component — when you’re taking into account all time horizons, they’re all important.”
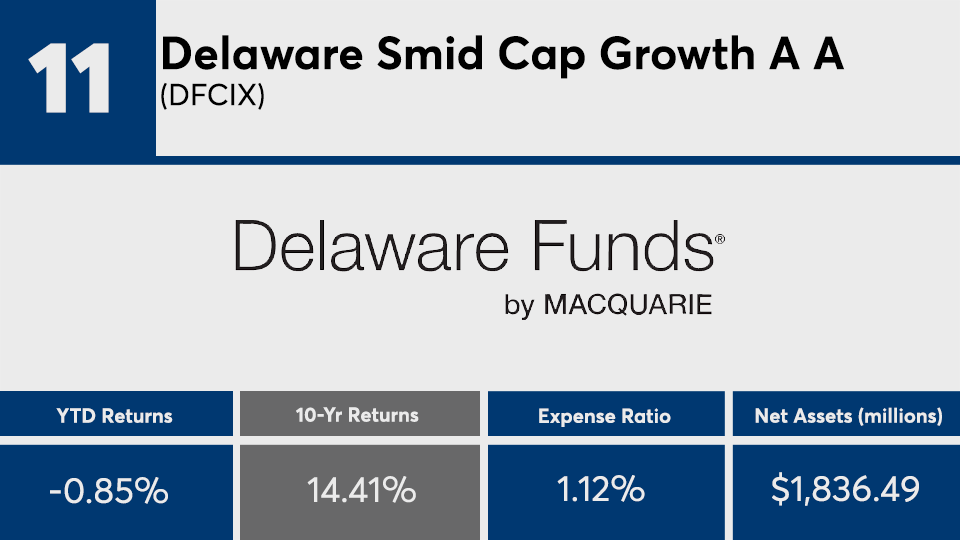
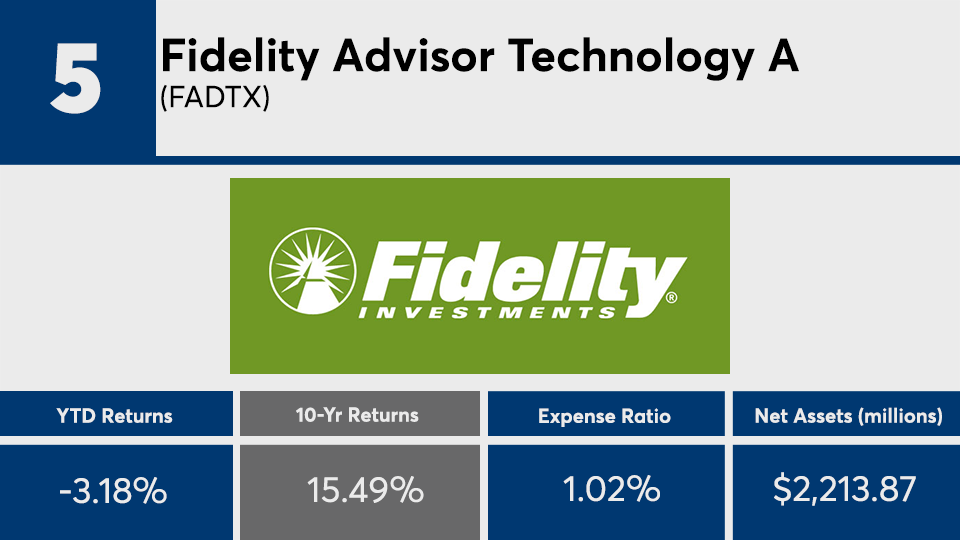
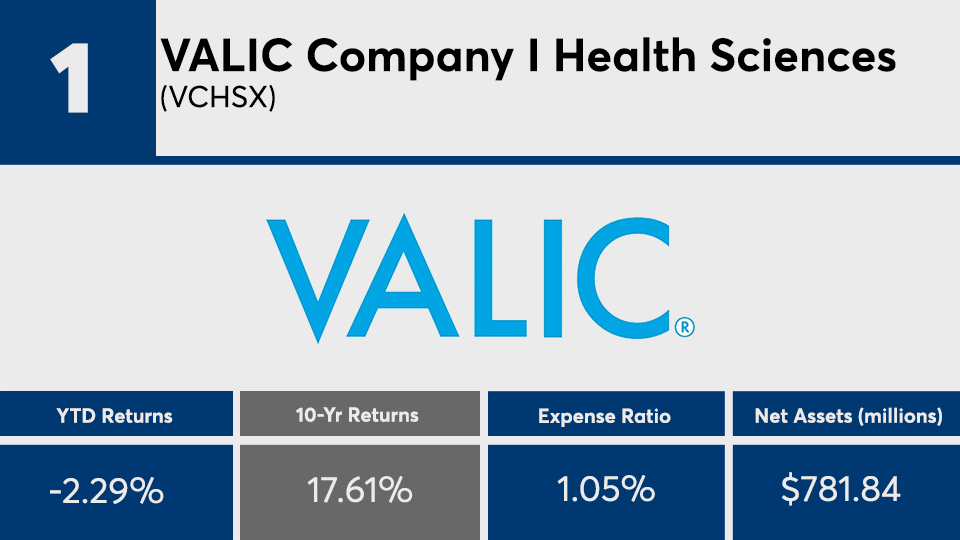
Scroll through to see the 20 funds with fees above 1% and the biggest 10-year returns through April 14. Funds with less than $500 million in AUM and investment minimums over $100,000 were excluded, as were leveraged and institutional funds. Assets and expense ratios, as well as year-to-date, one-, three-, five- and 10-year returns are listed for each. The data show each fund's primary share class. All data is from Morningstar Direct.


