Top-performing precious metals funds over 5 years

Complimentary Access Pill
Enjoy complimentary access to top ideas and insights — selected by our editors.

As markets have struggled in the first eight months of the year, the price of gold has surged. And although funds tracking the sector have sported flashy gains, one thing is always certain in the fund world: yesterday’s glitz may not be an indicator of tomorrow’s glam.

The 20 top-performing funds that track Morningstar’s precious metals equities category — those focusing on mining stocks and with holdings in bullion, silver, platinum and palladium — have posted double-digit returns over the last five years. Their gains have only improved over the three- and- year-to-date periods, data show.

With an average return of more than 21%, funds at the top have nearly doubled the broader fund industry over five years. For comparison, index trackers such as the SPDR S&P 500 ETF Trust (SPY) and the SPDR Dow Jones Industrial Average ETF Trust (DIA), have posted five-year gains of 12.27% and 14.46%, respectively. With an average YTD return of nearly 40%, the long-term leaders improved where the index-trackers have lagged — SPY and DIA have posted a YTD gain of 5.7% and loss of 0.7%, respectively.

In bonds, the iShares Core U.S. Aggregate Bond ETF (AGG) has managed a YTD gain of 6.78% and five-year gain of 4.24%, data show.

“If you’re looking at the five-year returns, some of these are up 20% — and YTD some are up over 40% — so it can be an attractive space,” says Tom Nations, manager research analyst at Morningstar. He adds that advisors with clients interested in the asset class must consider an even longer-term view. “If you look over the long term, the returns are pretty meager, especially when you consider how much they have struggled in the five years prior to this five-year period.”

To be sure, the five-year leaders have posted a roughly 1.5% loss over the last 10 years, data show. SPY and DIA, meanwhile, have managed gains of 14.3% and 13.1%, over the period. The AGG generated a 10-year gain of 3.63%.

Fees among the leaders in the precious metals equities sector are also high. With an average net expense ratio of roughly 94 basis points, these funds are well above the 0.45% investors paid on average for fund investing overall last year, according to Morningstar’s most recent annual fee survey.

“For gold, it's all up to whether people are willing to pay more for it,” Nations explains. “You don't want to be predicting the future of gold at $2,100 an ounce, which it was at earlier this month, to say whether it's going to go up or down. It has to be more up to what the client wants.”

Scroll through to see the 20 mutual funds and ETFs tracking Morningstar’s equity precious metals category with the biggest five-year gains through Aug. 14. Funds with less than $100 million in AUM and with investment minimums over $100,000 were excluded, as were leveraged and institutional funds. Assets and expense ratios, as well as YTD, one-, three-, five- and 10-year returns are listed for each. The data show each fund's primary share class. All data is from Morningstar Direct.

FP081720_20 copy.png

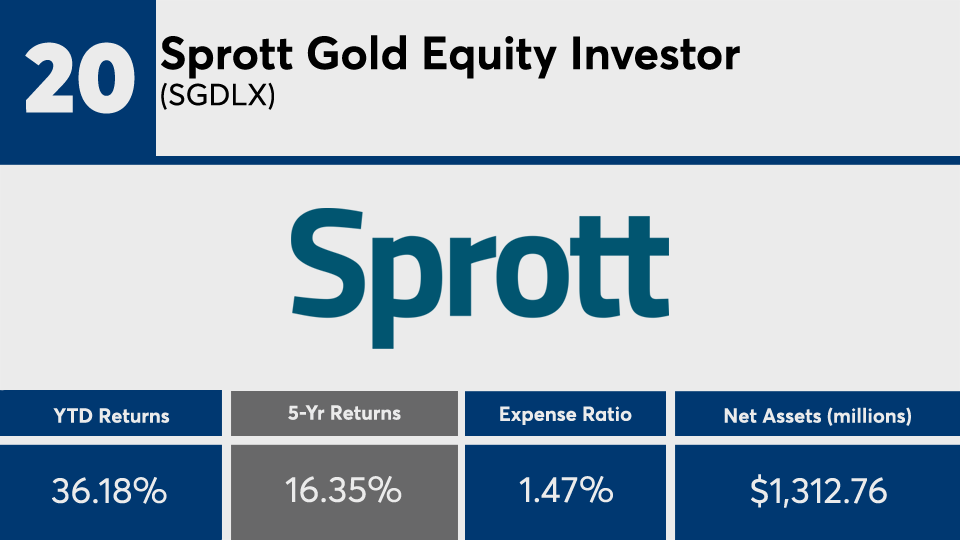
Sprott Gold Equity Investor (SGDLX)

1-Yr. Return: 39.64%
3-Yr. Annualized Return: 15.05%
10-Yr. Annualized Return: -1.18%
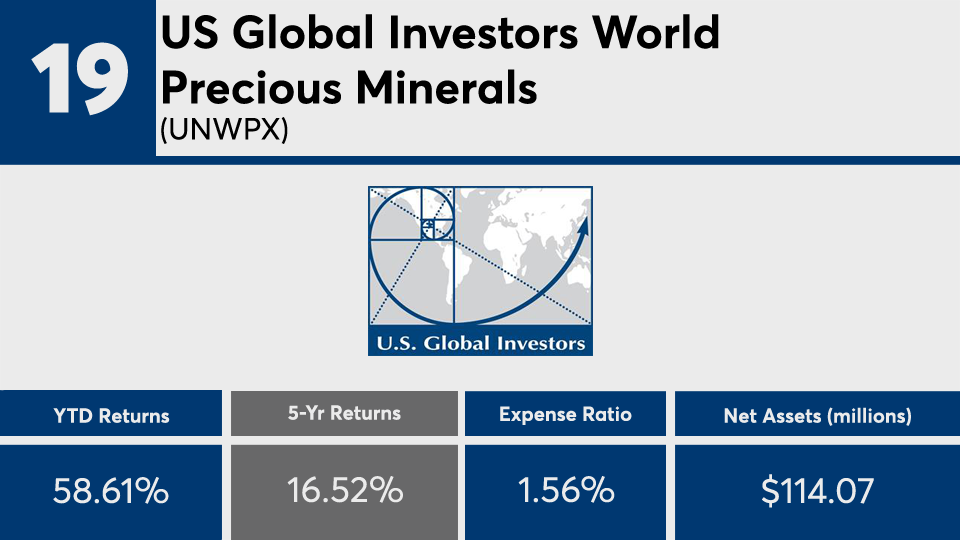
FP081720_19 copy.png

US Global Investors World Precious Minerals (UNWPX)

1-Yr. Return: 61.54%
3-Yr. Annualized Return: 7.99%
10-Yr. Annualized Return: -4.35%
FP081720_18 copy.png

Sprott Junior Gold Miners ETF (SGDJ)

1-Yr. Return: 32.11%
3-Yr. Annualized Return: 12.11%
10-Yr. Annualized Return: N/A
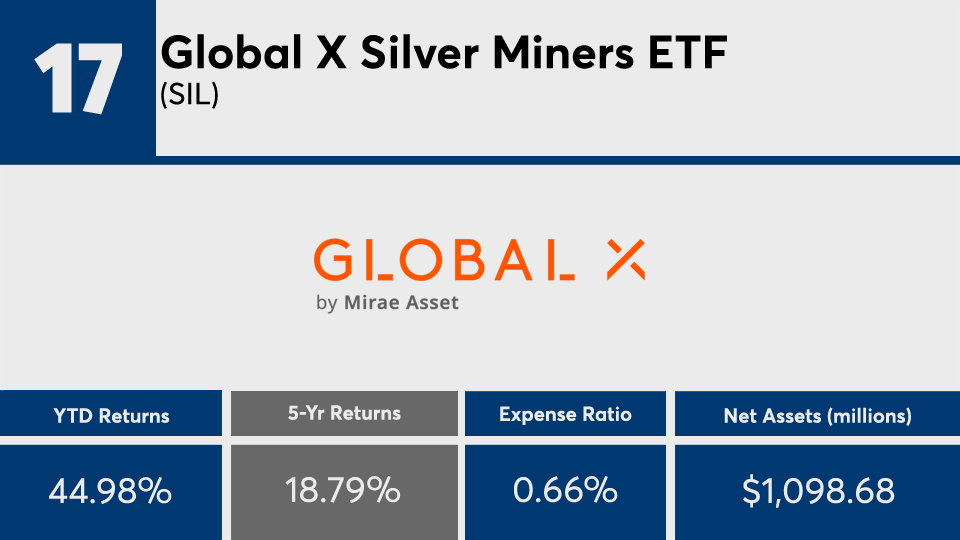
FP081720_17 copy.png

Global X Silver Miners ETF (SIL)

1-Yr. Return: 69.7%
3-Yr. Annualized Return: 13.55%
10-Yr. Annualized Return: 1.88%
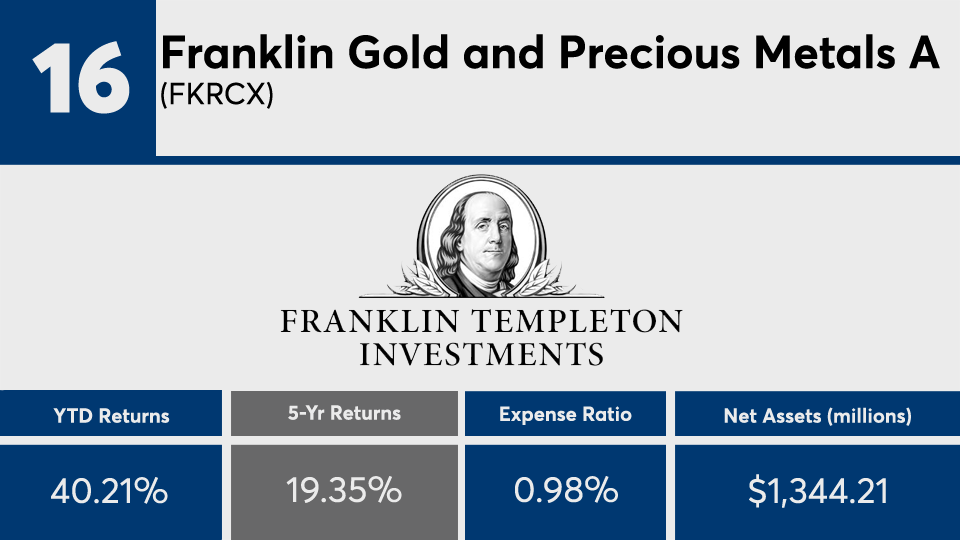
FP081720_16 copy.png

Franklin Gold and Precious Metals A (FKRCX)

1-Yr. Return: 51.84%
3-Yr. Annualized Return: 19.88%
10-Yr. Annualized Return: -1.8%
Front Load: 5.5%
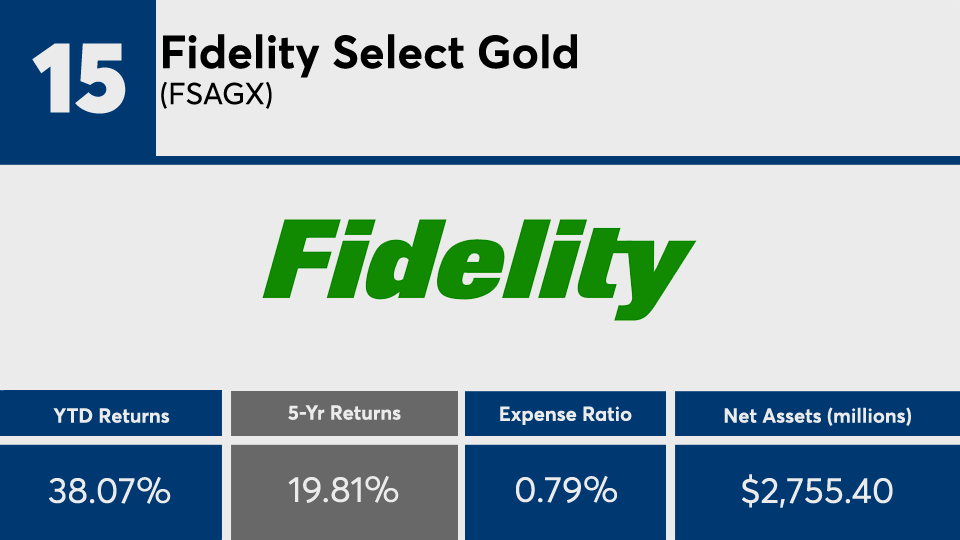
FP081720_15 copy.png

Fidelity Select Gold (FSAGX)

1-Yr. Return: 42.04%
3-Yr. Annualized Return: 17.69%
10-Yr. Annualized Return: -1.44%
FP081720_14 copy.png

Wells Fargo Precious Metals A (EKWAX)

1-Yr. Return: 40.94%
3-Yr. Annualized Return: 19.14%
10-Yr. Annualized Return: -0.73%
Front Load: 5.75%
FP081720_13 copy.png

USAA Precious Metals and Minerals (USAGX)

1-Yr. Return: 44.33%
3-Yr. Annualized Return: 21.21%
10-Yr. Annualized Return: -1.98%
FP081720_12 copy.png

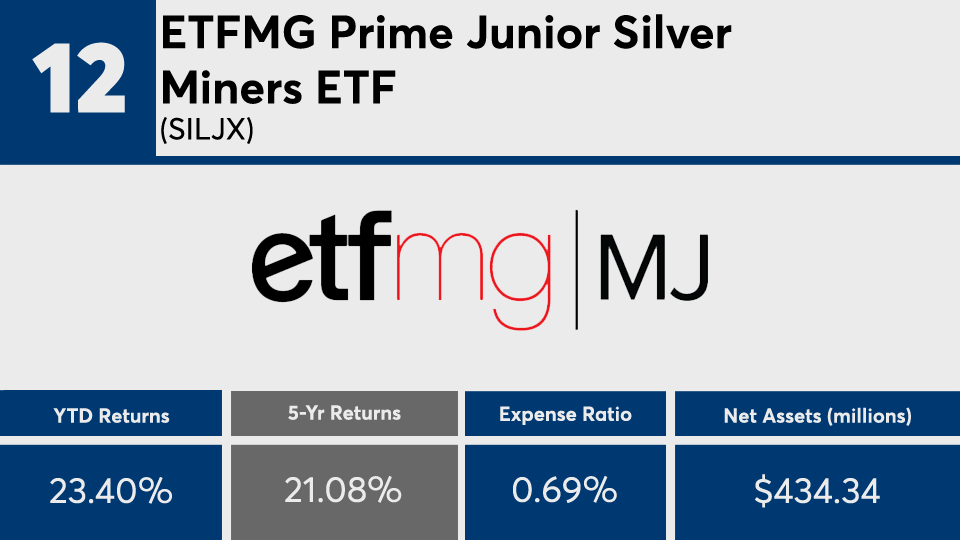
ETFMG Prime Junior Silver Miners ETF (SILJ)

1-Yr. Return: 51.08%
3-Yr. Annualized Return: 9.37%
10-Yr. Annualized Return: N/A
FP081720_11 copy.png

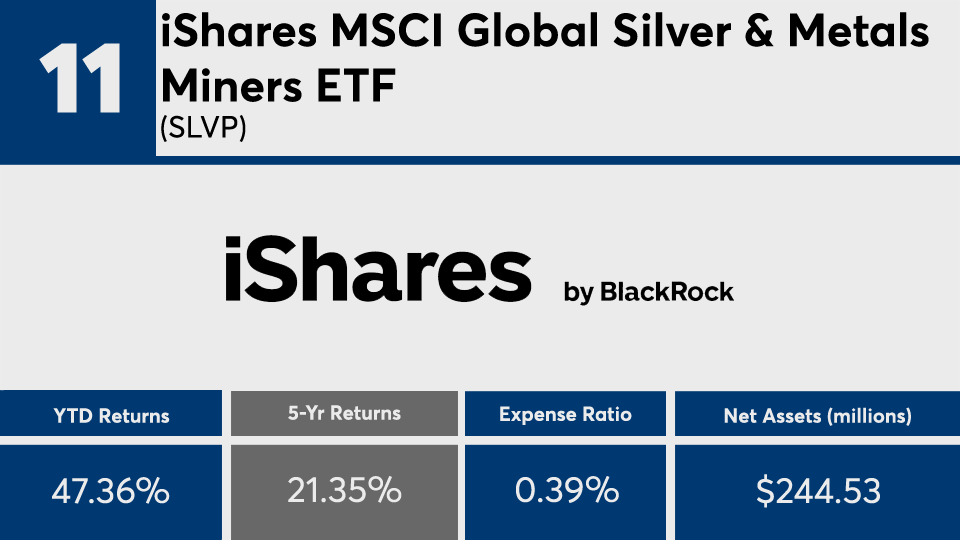
iShares MSCI Global Silver & Metals Miners ETF (SLVP)

1-Yr. Return: 68.53%
3-Yr. Annualized Return: 16.53%
10-Yr. Annualized Return: N/A
FP081720_10 copy.png

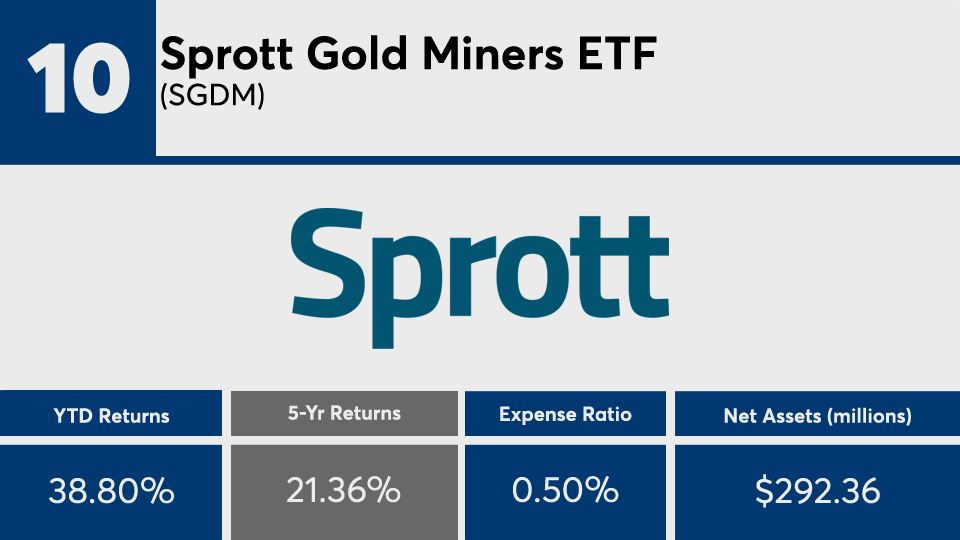
Sprott Gold Miners ETF (SGDM)

1-Yr. Return: 42.12%
3-Yr. Annualized Return: 19.73%
10-Yr. Annualized Return: N/A
FP081720_9 copy.png

VanEck International Investors Gold A (INIVX)

1-Yr. Return: 50.1
3-Yr. Annualized Return: 20.87
10-Yr. Annualized Return: 0.17
Front Load: 5.75%
FP081720_8 copy.png

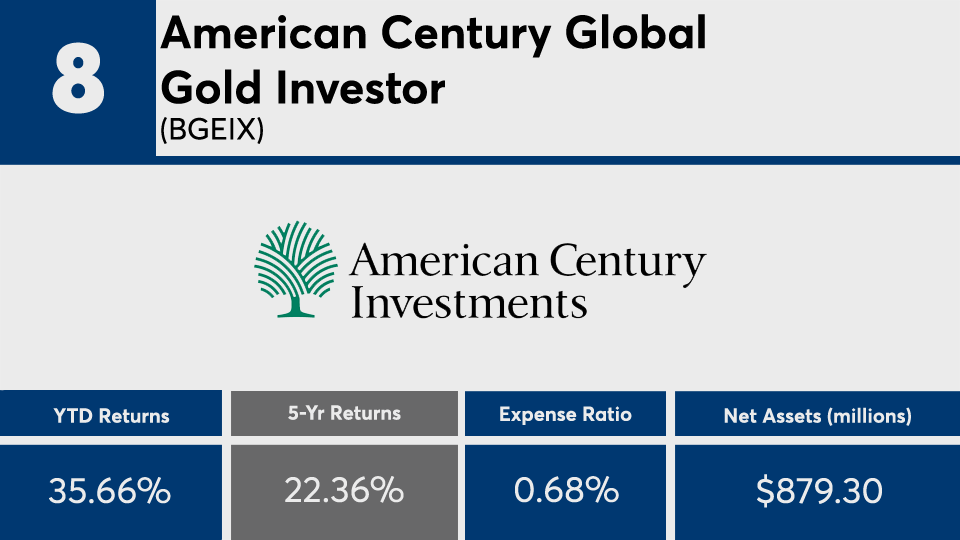
American Century Global Gold Investor (BGEIX)

1-Yr. Return: 38.84%
3-Yr. Annualized Return: 20.67%
10-Yr. Annualized Return: -0.68%
FP081720_7 copy.png

US Global Investors Gold & Precious Metals (USERX)

1-Yr. Return: 46.45%
3-Yr. Annualized Return: 23.91%
10-Yr. Annualized Return: 1.1%
FP081720_6 copy.png

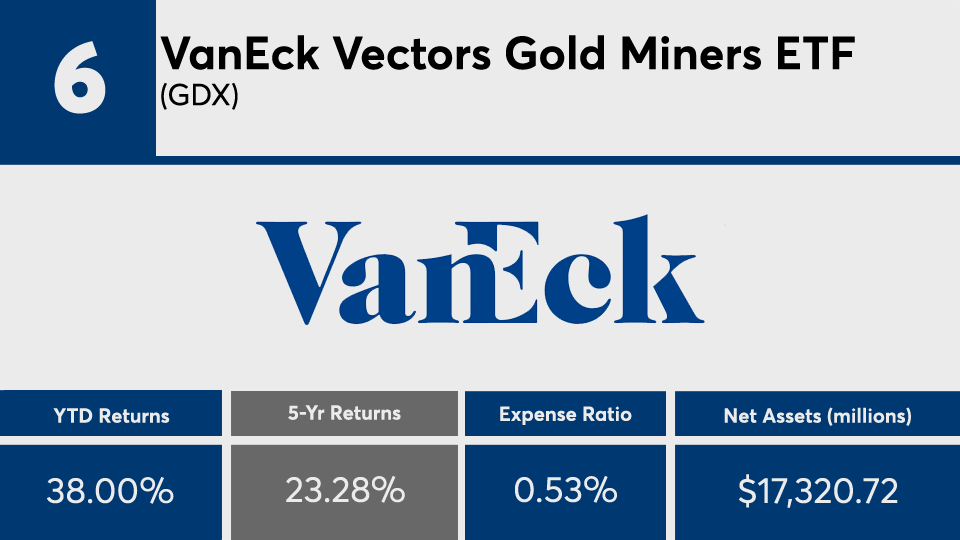
VanEck Vectors Gold Miners ETF (GDX)

1-Yr. Return: 42.15%
3-Yr. Annualized Return: 21.37%
10-Yr. Annualized Return: -1.38%
FP081720_5 copy.png

Rydex Precious Metals Investor (RYPMX)

1-Yr. Return: 57.49%
3-Yr. Annualized Return: 21.39%
10-Yr. Annualized Return: -0.51%
FP081720_4 copy.png

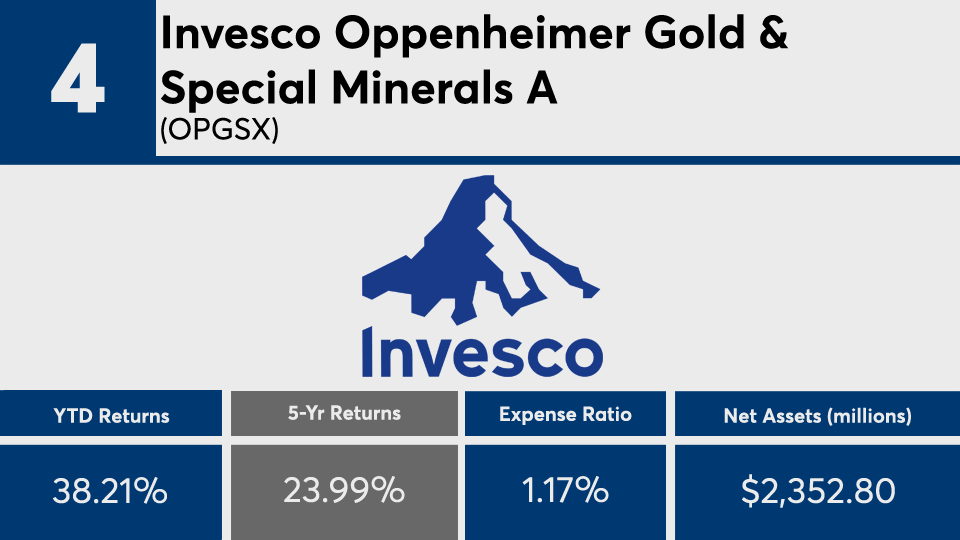
Invesco Oppenheimer Gold & Special Minerals A (OPGSX)

1-Yr. Return: 47.61%
3-Yr. Annualized Return: 22.66%
10-Yr. Annualized Return: -0.56%
Front Load: 5.5%
FP081720_3 copy.png

VanEck Vectors Junior Gold Miners ETF (GDXJ)

1-Yr. Return: 43.42%
3-Yr. Annualized Return: 20.37%
10-Yr. Annualized Return: -4.08%
FP081720_2 copy.png

EuroPac Gold A (EPGFX)

1-Yr. Return: 49.21%
3-Yr. Annualized Return: 19.22%
10-Yr. Annualized Return: N/A
Front Load: 4.5%
FP081720_1 copy.png

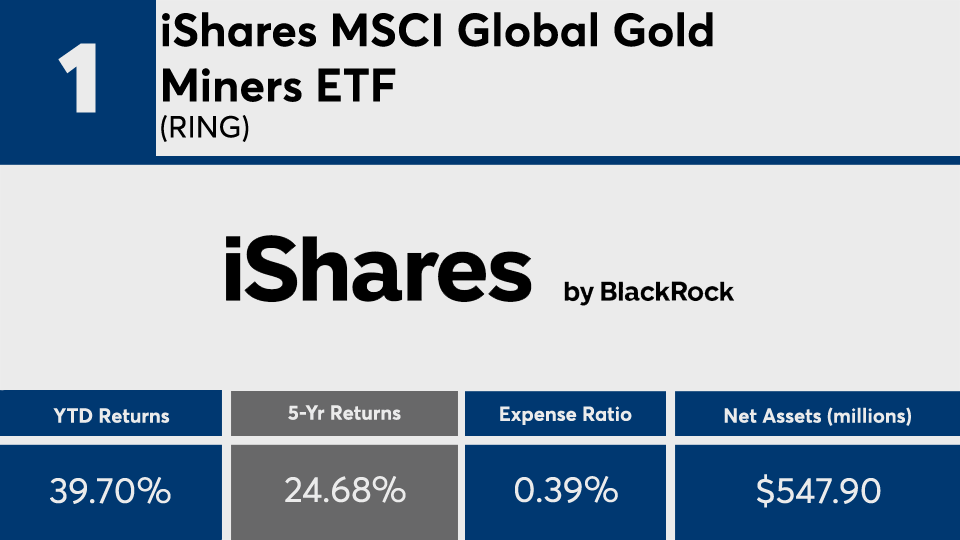
iShares MSCI Global Gold Miners ETF (RING)

1-Yr. Return: 48.78%
3-Yr. Annualized Return: 22.44%
10-Yr. Annualized Return: N/A
MORE FROM FINANCIAL PLANNING