Funds with the biggest 15-year losses

The 20 funds with the worst 15-year performance figures, and at least $100 million in assets under management, posted an overall loss of more than 2%, Morningstar Direct data show. Over the last year, many of the same funds have made up ground with the group posting an overall one-year gain of more than 16%.

Unlike funds with the biggest 15-year returns, there are many reasons why these funds performed so poorly — “being short equity risk during one of the greatest bull-markets in history,” as well long commodity exposures during a “severe economic collapse due to a pandemic,” are just a couple, explains Chris Shea, CIO at WealthSource, a full-service $1.5 billion RIA.

“It reminds me of the beginning of the novel ‘Anna Karenina,’ which reads, ‘each unhappy family is unhappy in its own way,’” Shea says. “While there are generally a few things in common among the best-performing funds, there are often a wide variety of ways to generate poor performance over any period of time.”

To be sure, funds in this ranking include a wide range of sectors. Equity energy had the largest showing with six of the worst 20 performers, with those tracking natural resources, commodities and market neutral sectors also posting poor long-term figures, data show.

Compared with the broader fund industry, index trackers such as SPDR S&P 500 ETF Trust (SPY) and the SPDR Dow Jones Industrial Average ETF Trust (DIA) delivered 15-year annualized gains of 9.87% and 9.91%, respectively, data show. Over the last year, SPY and DIA had returns of 23.85% and 16.73%, respectively.

In bonds, the iShares Core U.S. Aggregate Bond ETF (AGG) recorded gains of 2.19% and 4.20% over the one- and 15-year periods, data show.

The top 20 funds here are also more costly than many of their peers. Ranging from as high as nearly 300 basis points, the funds carried an overall net expense ratio of 1.32%, nearly three times the 0.45% investors paid for fund investing in 2019, according to Morningstar’s most recent annual fee survey.

Despite their high cost, it was their focus on unfavorable sectors that landed them on this list, notes Orion Advisor Solutions CIO Rusty Vanneman. That said, analysis of the worst-performing funds is one way for advisors to discuss with clients their long term plans, he adds.

“To build wealth, one needs to invest and stay invested,” Vanneman says. “Global diversification builds resilience into portfolios, especially given the cyclical nature of the markets. All sectors have their days in the sun, and all have their share of rainy days. It’s best to stay diversified.”

Scroll through to see the 20 funds, with more than $100 million in AUM, and the biggest 15-year annualized losses. Assets and average expense ratios, as well as year-to-date, one-, three-, five and 10-year returns through Feb. 25 are also listed for each. The data show each fund's primary share class and current portfolio manager or managers. All data is from Morningstar Direct.

FP030221_20 copy.png

Fidelity Select Consumer Finance Portfolio (FSVLX)

YTD Return: 12.86%
3-Yr. Annualized Return: 10.74%
5-Yr. Annualized Return: 16.94%
10-Yr. Annualized Return: 12.87%
Inception Date: Dec. 16, 1985
FP030221_19 copy.png

AB International Value A (ABIAX)

YTD Return: 5.34%
3-Yr. Annualized Return: -2.29%
5-Yr. Annualized Return: 5.67%
10-Yr. Annualized Return: 1.91%
Minimum Initial Investment: $2,500
Front Load: 4.25%
Inception Date: March 29, 2001
FP030221_18 copy.png

Fidelity Advisor Energy I (FANIX)

YTD Return: 31.21
3-Yr. Annualized Return: -8.28
5-Yr. Annualized Return: 0.69
10-Yr. Annualized Return: -3.11
Inception Date: July 3, 1995
FP030221_17 copy.png

Fidelity Select Energy (FSENX)

YTD Return: 30.97%
3-Yr. Annualized Return: -8.43%
5-Yr. Annualized Return: 0.65%
10-Yr. Annualized Return: -3.15%
Inception Date: July 14, 1981
FP030221_16 copy.png

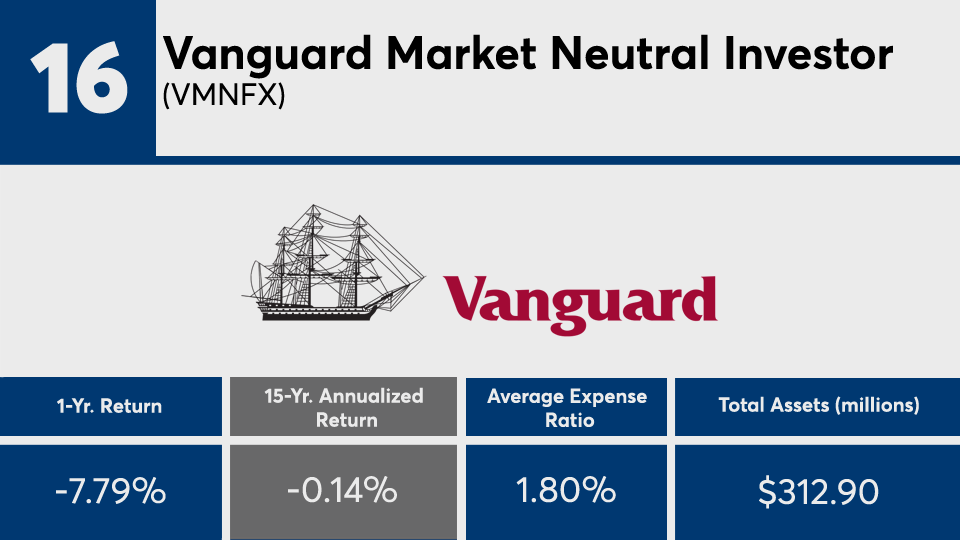
Vanguard Market Neutral Investor (VMNFX)

YTD Return: 2.24%
3-Yr. Annualized Return: -6.87%
5-Yr. Annualized Return: -4.85%
10-Yr. Annualized Return: 0%
Minimum Initial Investment: $50,000
Inception Date: Nov. 11, 1998
FP030221_15 copy.png

US Global Investors World Precious Minerals (UNWPX)

YTD Return: -2.47%
3-Yr. Annualized Return: 15.43%
5-Yr. Annualized Return: 12.95%
10-Yr. Annualized Return: -6.56%
Minimum Initial Investment: $5,000
Inception Date: Nov. 27, 1985
FP030221_14 copy.png

Franklin Natural Resources A (FRNRX)

YTD Return: 22.04%
3-Yr. Annualized Return: -6.5%
5-Yr. Annualized Return: 2.97%
10-Yr. Annualized Return: -6%
Minimum Initial Investment: $1,000
Front Load: 5.5%
Inception Date: June 5, 1995
FP030221_13 copy.png

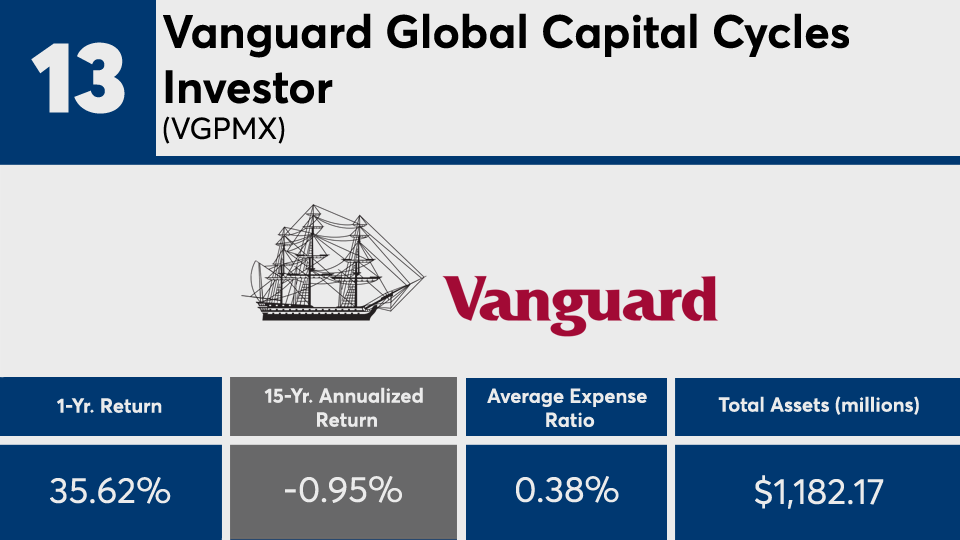
Vanguard Global Capital Cycles Investor (VGPMX)

YTD Return: 10.98%
3-Yr. Annualized Return: 4.88%
5-Yr. Annualized Return: 8.88%
10-Yr. Annualized Return: -6.1%
Minimum Initial Investment: $3,000
Inception Date: May 23, 1984
FP030221_12 copy.png

BlackRock Energy Opportunities Investor A (BACAX)

YTD Return: 22.34%
3-Yr. Annualized Return: -6.38%
5-Yr. Annualized Return: 1.36%
10-Yr. Annualized Return: -5.67%
Minimum Initial Investment: $1,000
Front Load: 5.25%
Inception Date: Feb. 16, 2005
FP030221_11 copy.png

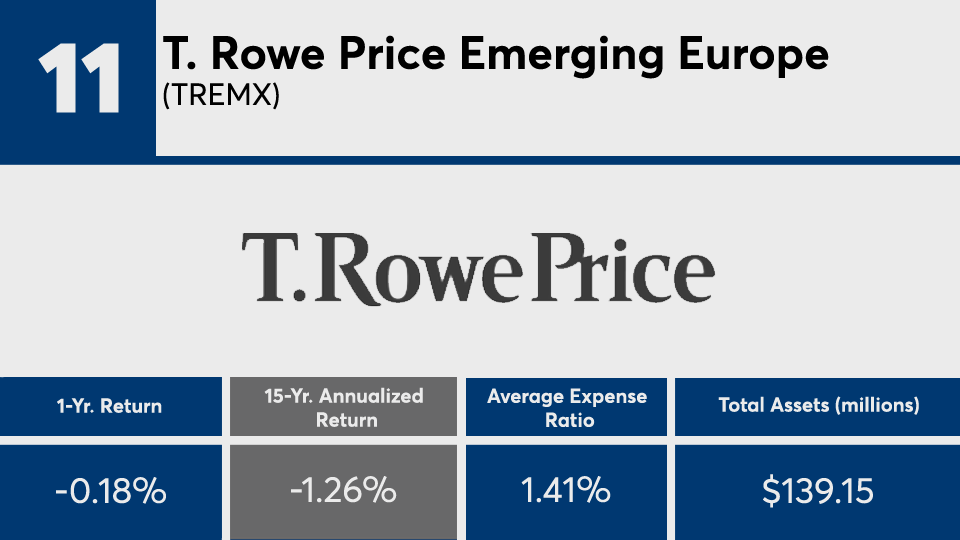
T. Rowe Price Emerging Europe (TREMX)

YTD Return: 3.01%
3-Yr. Annualized Return: -1.37%
5-Yr. Annualized Return: 10.24%
10-Yr. Annualized Return: -2.18%
Minimum Initial Investment: $2,500
Inception Date: Aug. 31, 2000
FP030221_10 copy.png

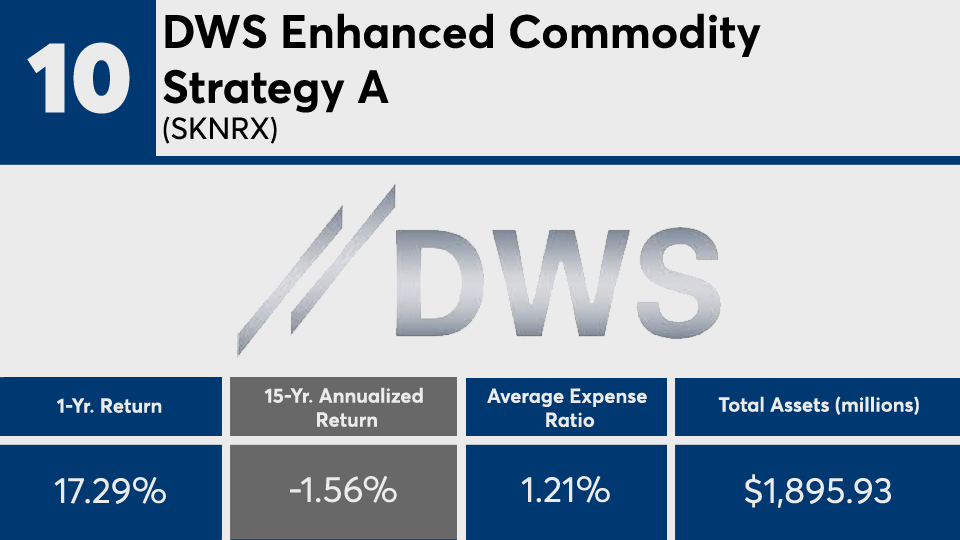
DWS Enhanced Commodity Strategy A (SKNRX)

YTD Return: 13.08%
3-Yr. Annualized Return: -0.28%
5-Yr. Annualized Return: 2.69%
10-Yr. Annualized Return: -3.46%
Minimum Initial Investment: $1,000
Front Load: 5.75%
Inception Date: Feb. 14, 2005
FP030221_9 copy.png

PIMCO Commodity Real Return Strategy A (PCRAX)

YTD Return: 13.74%
3-Yr. Annualized Return: 2.91%
5-Yr. Annualized Return: 6.02%
10-Yr. Annualized Return: -4.64%
Minimum Initial Investment: $1,000
Front Load: 5.5%
Inception Date: Nov. 29, 2002
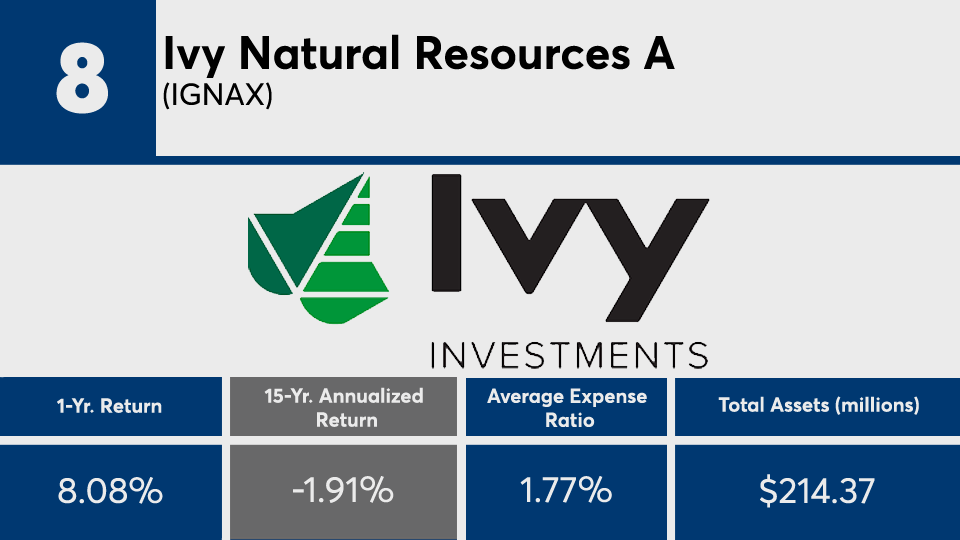
FP030221_8 copy.png

Ivy Natural Resources A (IGNAX)

YTD Return: 11.43%
3-Yr. Annualized Return: -5.5%
5-Yr. Annualized Return: 2.57%
10-Yr. Annualized Return: -5.51%
Minimum Initial Investment: $750
Front Load: 3.5%
Inception Date: Jan. 2, 1997
FP030221_7 copy.png

Victory Global Natural Resources A (RSNRX)

YTD Return: 39.81%
3-Yr. Annualized Return: -7.52%
5-Yr. Annualized Return: 3.52%
10-Yr. Annualized Return: -6.58%
Minimum Initial Investment: $2,500
Front Load: 5.75%
Inception Date: Nov. 15, 1995
FP030221_6 copy.png

Invesco Energy A (IENAX)

YTD Return: 27.12%
3-Yr. Annualized Return: -11.14%
5-Yr. Annualized Return: -2.9%
10-Yr. Annualized Return: -7.76%
Minimum Initial Investment: $1,000
Front Load: 5.5%
Inception Date: March, 28, 2002
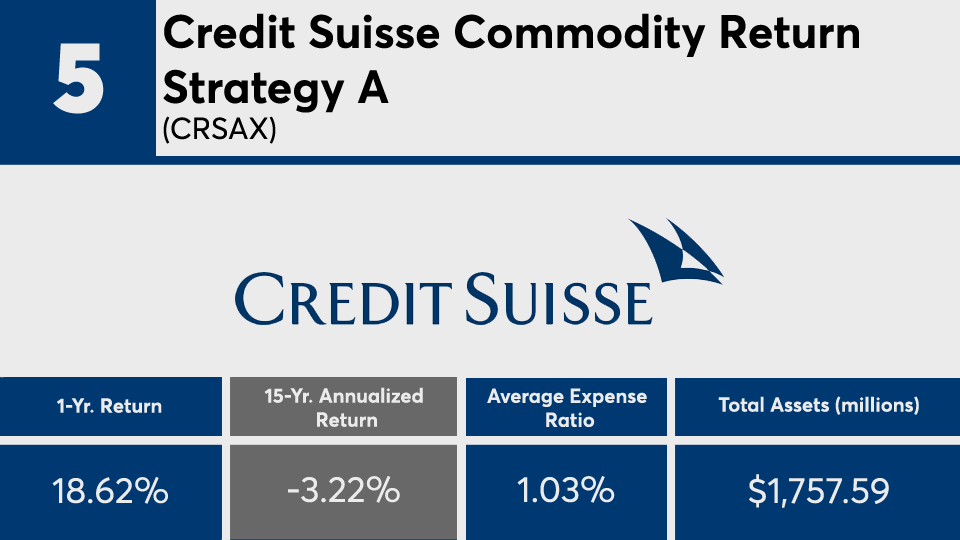
FP030221_5 copy.png

Credit Suisse Commodity Return Strategy A (CRSAX)

YTD Return: 11.86%
3-Yr. Annualized Return: 1.04%
5-Yr. Annualized Return: 4.02%
10-Yr. Annualized Return: -5.64%
Minimum Initial Investment: $2,500
Front Load: 4.75%
Inception Date: Dec. 30, 2004
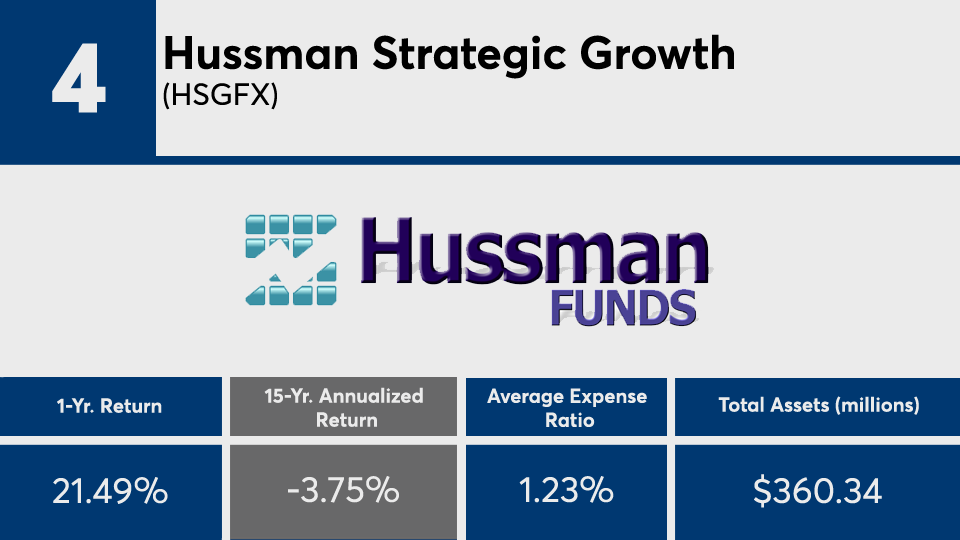
FP030221_4 copy.png

Hussman Strategic Growth (HSGFX)

YTD Return: 6.68%
3-Yr. Annualized Return: 2.38%
5-Yr. Annualized Return: -4.73%
10-Yr. Annualized Return: -5.11%
Minimum Initial Investment: $1,000
Redemption Load: 1.5%
Inception Date: July 24, 2000
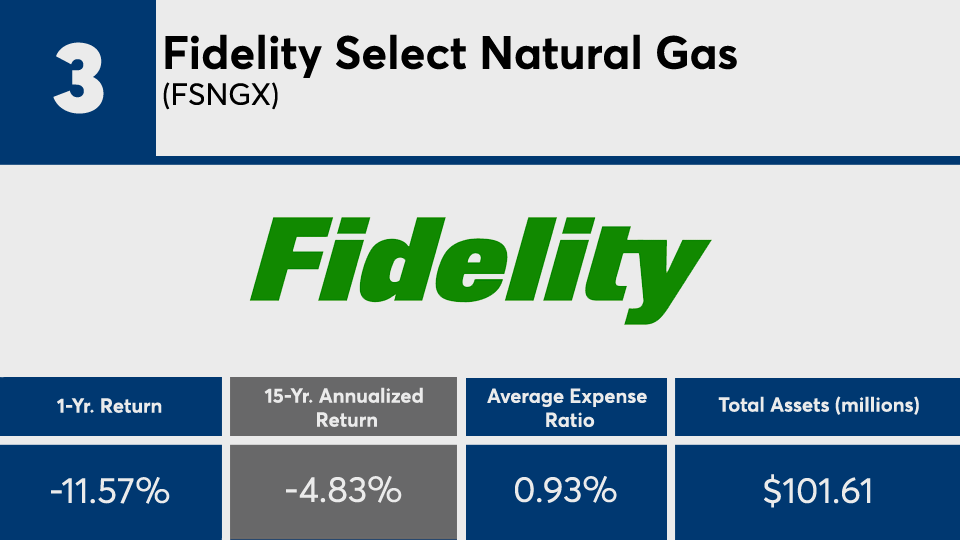
FP030221_3 copy.png

Fidelity Select Natural Gas (FSNGX)

YTD Return: 23.72%
3-Yr. Annualized Return: -15.56%
5-Yr. Annualized Return: -3.86%
10-Yr. Annualized Return: -8.05%
Inception Date: April, 21, 1993
FP030221_2 copy.png

Fidelity Select Energy Service Portfolio (FSESX)

YTD Return: 30.55%
3-Yr. Annualized Return: -21.64%
5-Yr. Annualized Return: -8.82%
10-Yr. Annualized Return: -10.75%
Inception Date: Dec. 16, 1985
FP030221_1 copy.png

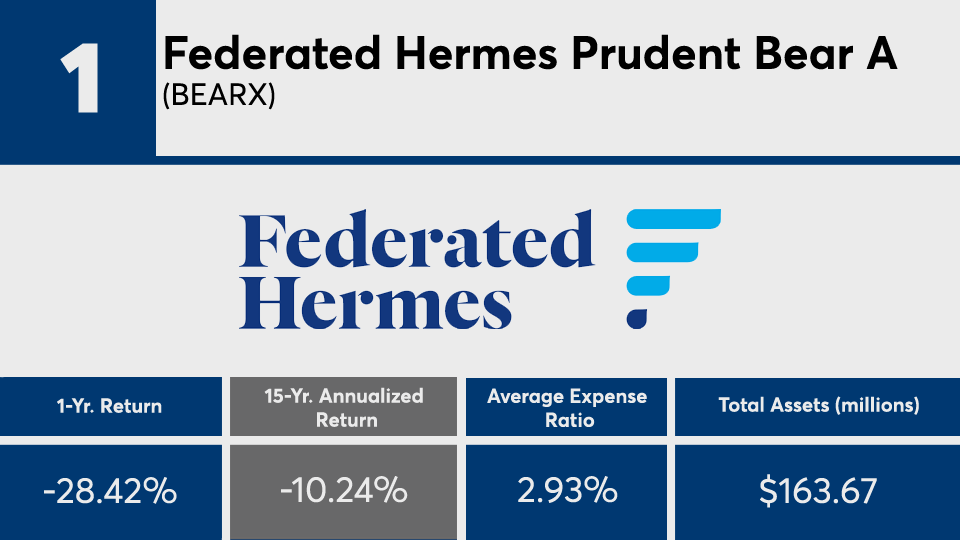
Federated Hermes Prudent Bear A (BEARX)

YTD Return: -5.11%
3-Yr. Annualized Return: -17.43%
5-Yr. Annualized Return: -17.48%
10-Yr. Annualized Return: -15.28%
Minimum Initial Investment: $1,500
Front Load: 5.5%
Inception Date: Dec. 28, 1995
MORE FROM FINANCIAL PLANNING