Funds with the biggest outflows of 2020

Double-digit gains and relatively low fees are not typical characteristics of funds with hefty outflows. But 2020 was an unusual year.

With the COVID-19 pandemic and presidential election dominating headlines and fueling volatility this year, many investors flocked away from stock funds just as markets were picking up, says Rob Glownia, senior portfolio manager and co-head of the investment committee at RiverFront Investment Group.

“Scary headlines and other crises can quickly derail an investment strategy, especially for individuals that don’t have professional help,” Glownia says. “It’s easy to sell stocks when the world seems dire, but it’s extremely difficult to get reinvested after going to cash. As this flow data suggests, many investors sold out of stocks in March but have missed out on the strong gains since then.”

Despite net outflows of more than $144 billion this year, the 20 mutual funds and ETFs on this list generated gains as high as 54%, Morningstar Direct data show.

Funds with the biggest YTD outflows recorded an average return of around 13.6%, slightly less than index trackers such as the SPDR S&P 500 ETF Trust (SPY) and SPDR Dow Jones Industrial Average ETF Trust (DIA), which delivered returns of 16.28% and 8.04%, respectively, over the same period. Over the longer term, SPY and DIA notched 10-year gains of 13.88% and 12.84% as funds with the biggest outflows had a return of 9.5%. SPY, meanwhile, recorded outflows of $22.84 billion this year, while DIA had $1.68 billion in inflows, over the same period.

In bonds, the iShares Core U.S. Aggregate Bond ETF (AGG) had gains of 7.05% and 3.75% over the YTD and 10-year periods. AGG, which has $84.4 billion in assets, saw YTD inflows of $10.6 billion, data show.

“Outflows weren’t isolated to the higher-fee equity funds,” Glownia adds. “In fact, some of the most competitively priced funds suffered the largest outflows.”

To be sure, funds in this ranking — most of which are mutual funds — carried net expense ratios from as low as 1 basis point to as high as nearly 100, data show. Their average of 0.50%, however, was slightly higher than the 0.45% investors paid last year, according to Morningstar’s most recent annual fee survey.

Glowania says rankings like these are a prime example of an advisor’s role in volatile times.

“A tailored financial plan and the support of an advisor can help tune out scary headlines and focus on achieving the long term goals of an investor,” he says.

Scroll through to see the 20 mutual funds and ETFs with the biggest YTD month-end outflows through Dec. 9. Funds with less than $500 million in AUM were excluded, as were funds with investment minimums above $100,000, leveraged and institutional funds. Assets and expense ratios, as well as YTD, one-, three- and five- returns and flows are also listed for each. Minimum initial investments and loads are also listed when applicable. The data show each fund's primary share class. All data is from Morningstar Direct.
FP121420_20 copy.png

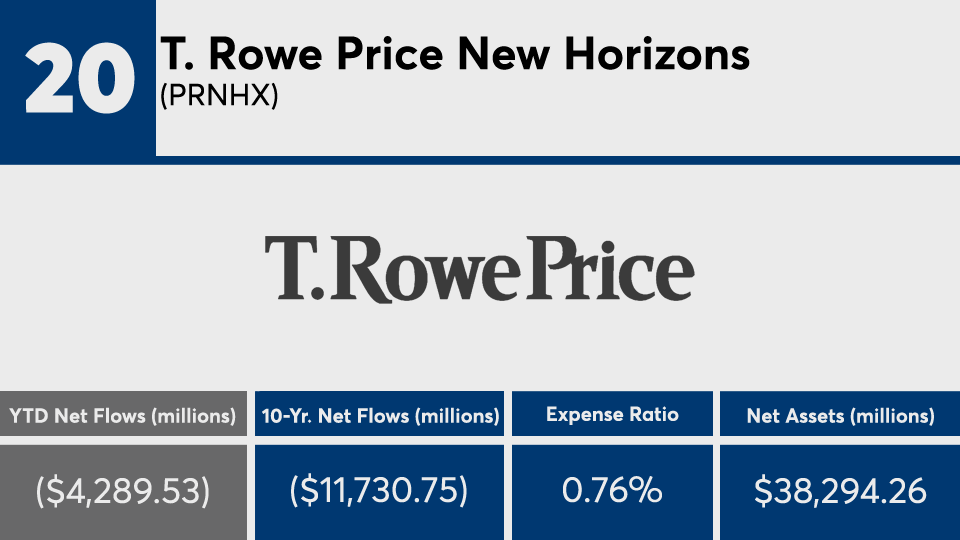
T. Rowe Price New Horizons (PRNHX)

YTD Return: 53.19%
1-Yr. Return: 54.82%
3-Yr. Annualized Return: 30.26%
5-Yr. Annualized Return: 25.11%
10- Yr. Annualized Return: 20.61%
1-Yr. Flows (millions): ($4,517.85)
3-Yr. Flows (millions): ($8,961.65)
5-Yr. Flows (millions): ($11,232.03)
Minimum Initial Investment: $2,500
FP121420_19 copy.png

iShares Core S&P Mid-Cap ETF (IJH)

YTD Return: 10.67%
1-Yr. Return: 13.08%
3-Yr. Annualized Return: 7.67%
5-Yr. Annualized Return: 11.32%
10- Yr. Annualized Return: 11.39%
1-Yr. Flows (millions): ($3,689.37)
3-Yr. Flows (millions): $1,557.24
5-Yr. Flows (millions): $9,042.94
FP121420_18 copy.png

American Funds Europacific Growth R6 (RERGX)

YTD Return: 20.4%
1-Yr. Return: 24.7%
3-Yr. Annualized Return: 9.86%
5-Yr. Annualized Return: 11.42%
10- Yr. Annualized Return: 7.92%
1-Yr. Flows (millions): ($4,558.12)
3-Yr. Flows (millions): $2,285.54
5-Yr. Flows (millions): $12,755.19
Minimum Initial Investment: $250
FP121420_17 copy.png

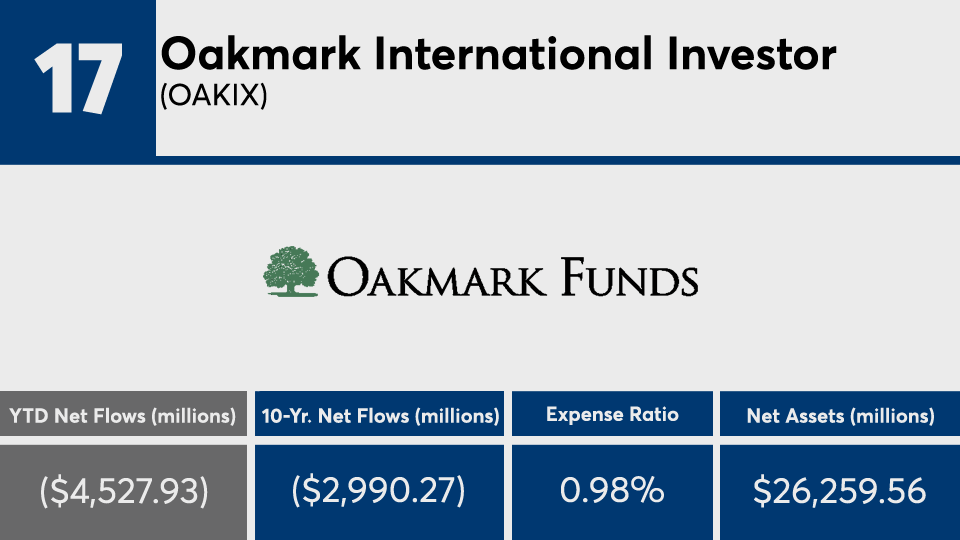
Oakmark International Investor (OAKIX)

YTD Return: 2.65%
1-Yr. Return: 6.25%
3-Yr. Annualized Return: -0.16%
5-Yr. Annualized Return: 6.36%
10- Yr. Annualized Return: 6.22%
1-Yr. Flows (millions): ($4,789.52)
3-Yr. Flows (millions): ($16,637.68)
5-Yr. Flows (millions): ($21,537.67)
Minimum Initial Investment: $1,000
FP121420_16 copy.png

Franklin Income A1 (FKINX)

YTD Return: 3.12%
1-Yr. Return: 5.36%
3-Yr. Annualized Return: 4.46%
5-Yr. Annualized Return: 7.24%
10- Yr. Annualized Return: 6.46%
1-Yr. Flows (millions): ($5,112.98)
3-Yr. Flows (millions): ($14,002.52)
5-Yr. Flows (millions): ($21,672.78)
Minimum Initial Investment: $1,000
Front Load: 3.75%
FP121420_15 copy.png

iShares MSCI Emerging Markets ETF (EEM)

YTD Return: 14.02%
1-Yr. Return: 21.41%
3-Yr. Annualized Return: 6.03%
5-Yr. Annualized Return: 11.48%
10- Yr. Annualized Return: 2.99%
1-Yr. Flows (millions): ($3,228.14)
3-Yr. Flows (millions): ($10,865.19)
5-Yr. Flows (millions): ($3,866.24)
FP121420_14 copy.png

American Funds Capital Income Builder A (CAIBX)

YTD Return: 2.52%
1-Yr. Return: 4.89%
3-Yr. Annualized Return: 4.17%
5-Yr. Annualized Return: 6.48%
10- Yr. Annualized Return: 6.65%
1-Yr. Flows (millions): ($5,464.07)
3-Yr. Flows (millions): ($15,612.13)
5-Yr. Flows (millions): ($24,679.11)
Minimum Initial Investment: $250
Front Load: 5.75%
FP121420_13 copy.png

DoubleLine Total Return Bond I (DBLTX)

YTD Return: 3.74%
1-Yr. Return: 3.58%
3-Yr. Annualized Return: 3.79%
5-Yr. Annualized Return: 3.42%
10- Yr. Annualized Return: 4.47%
1-Yr. Flows (millions): ($5,514.90)
3-Yr. Flows (millions): ($5,839.82)
5-Yr. Flows (millions): ($4,005.44)
Minimum Initial Investment: $100,000
FP121420_12 copy.png

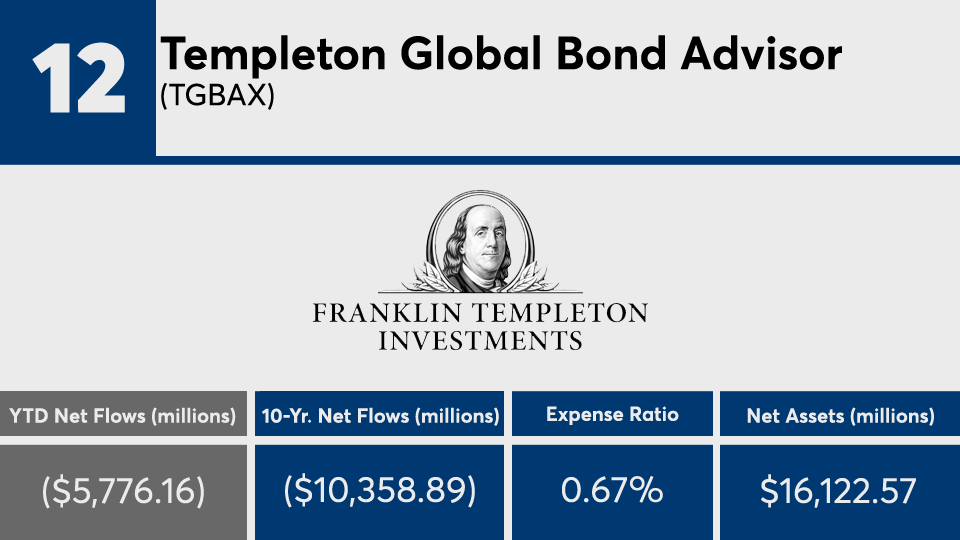
Templeton Global Bond Advisor (TGBAX)

YTD Return: -4.6%
1-Yr. Return: -3.21%
3-Yr. Annualized Return: -1.44%
5-Yr. Annualized Return: 1.09%
10- Yr. Annualized Return: 2.08%
1-Yr. Flows (millions): ($6,986.45)
3-Yr. Flows (millions): ($12,227.33)
5-Yr. Flows (millions): ($22,601.39)
Minimum Initial Investment: $100,000
FP121420_11 copy.png

T. Rowe Price Mid-Cap Growth (RPMGX)

YTD Return: 21.22%
1-Yr. Return: 24.06%
3-Yr. Annualized Return: 16.05%
5-Yr. Annualized Return: 15.55%
10- Yr. Annualized Return: 14.62%
1-Yr. Flows (millions): ($6,410.08)
3-Yr. Flows (millions): ($11,759.70)
5-Yr. Flows (millions): ($16,112.98)
Minimum Initial Investment: $2,500
FP121420_10 copy.png

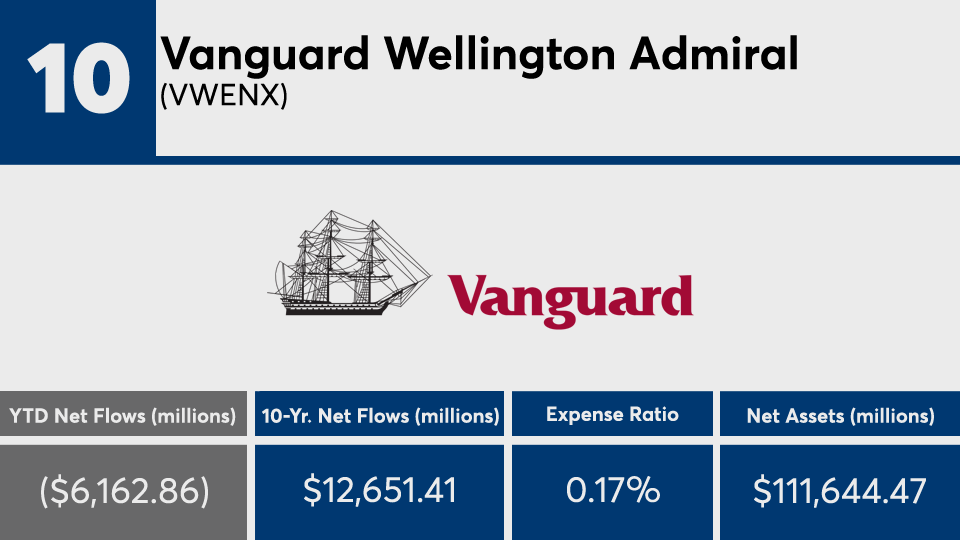
Vanguard Wellington Admiral (VWENX)

YTD Return: 9.81%
1-Yr. Return: 11.73%
3-Yr. Annualized Return: 9.53%
5-Yr. Annualized Return: 10.54%
10- Yr. Annualized Return: 10.1%
1-Yr. Flows (millions): ($6,123.82)
3-Yr. Flows (millions): ($13,331.15)
5-Yr. Flows (millions): ($11,409.39)
Minimum Initial Investment: $50,000
FP121420_09 copy.png

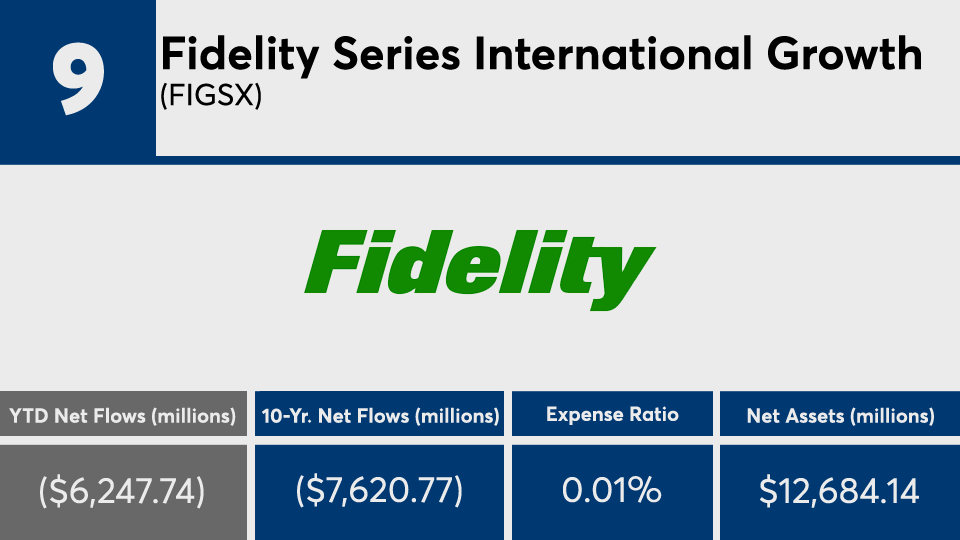
Fidelity Series International Growth (FIGSX)

YTD Return: 15.01%
1-Yr. Return: 18.03%
3-Yr. Annualized Return: 12.29%
5-Yr. Annualized Return: 11.78%
10- Yr. Annualized Return: 9.03%
1-Yr. Flows (millions): ($6,305.53)
3-Yr. Flows (millions): ($6,680.12)
5-Yr. Flows (millions):($7,214.88)
FP121420_08 copy.png

Dodge & Cox Stock (DODGX)

YTD Return: 7.36%
1-Yr. Return: 10.77%
3-Yr. Annualized Return: 8.24%
5-Yr. Annualized Return: 12.01%
10- Yr. Annualized Return: 12.29%
1-Yr. Flows (millions): ($7,267.71)
3-Yr. Flows (millions): ($13,143.46)
5-Yr. Flows (millions): ($18,858.89)
Minimum Initial Investment: $2,500
FP121420_07 copy.png

Strategic Advisers Core Income (FPCIX)

YTD Return: 8.78%
1-Yr. Return: 9.02%
3-Yr. Annualized Return: 5.86%
5-Yr. Annualized Return: 5.19%
10- Yr. Annualized Return: 4.41%
1-Yr. Flows (millions): ($5,924.13)
3-Yr. Flows (millions): ($2,841.21)
5-Yr. Flows (millions): $2,269.24
FP121420_06 copy.png

Vanguard PRIMECAP Admiral (VPMAX)

YTD Return: 15.86%
1-Yr. Return: 19.72%
3-Yr. Annualized Return: 13.65%
5-Yr. Annualized Return: 15.69%
10- Yr. Annualized Return: 15.3%
1-Yr. Flows (millions): ($7,591.19)
3-Yr. Flows (millions): ($11,872.68)
5-Yr. Flows (millions):($10,972.10)
Minimum Initial Investment: $50,000
FP121420_05 copy.png

Dodge & Cox International Stock (DODFX)

YTD Return: 1.08%
1-Yr. Return: 5.42%
3-Yr. Annualized Return: 1.4%
5-Yr. Annualized Return: 6.1%
10- Yr. Annualized Return: 4.72%
1-Yr. Flows (millions): (8,392.24)
3-Yr. Flows (millions): (21,950.35)
5-Yr. Flows (millions): (31,181.75)
Minimum Initial Investment: $2,500
FP121420_04 copy.png

Fidelity Contrafund (FCNTX)

YTD Return: 30.49%
1-Yr. Return: 34.62%
3-Yr. Annualized Return: 18.56%
5-Yr. Annualized Return: 17.43%
10- Yr. Annualized Return: 15.29%
1-Yr. Flows (millions): ($12,326.84)
3-Yr. Flows (millions): ($27,156.85)
5-Yr. Flows (millions): ($39,067.32)
FP121420_03 copy.png

iShares MSCI EAFE ETF (EFA)

YTD Return: 5.11%
1-Yr. Return: 8.11%
3-Yr. Annualized Return: 4.16%
5-Yr. Annualized Return: 6.95%
10- Yr. Annualized Return: 5.46%
1-Yr. Flows (millions): ($10,468.27)
3-Yr. Flows (millions): ($29,263.38)
5-Yr. Flows (millions): ($15,844.60)
FP121420_02 copy.png

Vanguard 500 Index Admiral (VFIAX)

YTD Return: 16.56%
1-Yr. Return: 19.83%
3-Yr. Annualized Return: 13.91%
5-Yr. Annualized Return: 14.63%
10- Yr. Annualized Return: 13.95%
1-Yr. Flows (millions): ($15,203.08)
3-Yr. Flows (millions): $8,233.46
5-Yr. Flows (millions): $30,677.21
Minimum Initial Investment: $3,000
FP121420_01 copy.png

T. Rowe Price Growth Stock (PRGFX)

YTD Return: 34.82%
1-Yr. Return: 38.8%
3-Yr. Annualized Return: 20.46%
5-Yr. Annualized Return: 18.55%
10- Yr. Annualized Return: 16.76%
1-Yr. Flows (millions): ($17,108.91)
3-Yr. Flows (millions): ($29,677.42)
5-Yr. Flows (millions): ($40,929.99)
Minimum Initial Investment: $2,500
MORE FROM FINANCIAL PLANNING