Want unlimited access to top ideas and insights?
Can funds that address diversity and sustainability deliver long-term outperformance? The answer, one expert says, is an unequivocal yes.
The 20 best-performing mutual funds and ETFs with holdings that pose the lowest ESG risk generated an average 10-year gain of more than 18%, according to data from Morningstar Direct. That comes in well above broader index trackers like the SPDR S&P 500 ETF Trust (SPY) and the SPDR Dow Jones Industrial Average ETF Tracker (DIA), which posted 10-year gains of 13.23% and 12.47%, over the same period. On the fixed-income side, the iShares Core US Aggregate Bond ETF (AGG) posted a 10-year return of 3.78%, data show.
“There’s a misconception out there that ESG will always underperform,” says Kostya Etus, director of research at Orion Portfolio Solutions. “Sometimes an advisor or client is reluctant to invest with their beliefs because they're worried about underperformance and there have been multiple studies that show you can in fact have your cake and eat it too, meaning you can invest in your beliefs in companies that are doing good for the world and outperform the market over the long-term.”
The decade’s top-performers also outpaced broader markets over the short term. With an average 1-year gain of 27.83%, the funds nearly tripled SPY’s 9.53% gain and trounced the 2.20% return posted by DIA over the same period. The AGG, meanwhile, reported a 1-year gain of 10.02%.
To generate ratings for low ESG risk, we looked at funds with above-average and high Morningstar Sustainability Ratings. To reach its conclusions, Morningstar used data from research firm Sustainalytics for access to company-level risk sustainability ratings. With measurements from negligible to severe, the ratings measure the degree to which a company's economic value may be at risk as a result of ESG issues, whether it be diversity and inclusion in the workplace or the impact of climate change on supply chain practices.
Access to the decade’s top-performing funds with above-average Morningstar Sustainability Ratings comes at a price. The overall net expense ratio is around 66 basis points, much higher than the broader industry’s average of 0.48%, according to Morningstar’s most recent annual fee survey, which reviewed the asset-weighted average expense ratios of all U.S. open-end mutual funds and ETFs.
Those at the top were also pricier than the industry’s biggest funds. For comparison, the $519.2 billion Vanguard 500 Index Admiral (VFIAX), the industry’s largest overall, has an expense ratio of 0.04% and 10-year return of 13.31%, data show. On the bonds side, the $269 billion Vanguard Total Bond Market Index Fund (VBTLX), had a 0.05% expense ratio and notched a 10-year gain of 3.82%. Over the last year, VFIAX and VBLTX posted gains of 9.51% and 10.14%, respectively.
“If you explain to clients that there’s a type of investing out there that can help make the workplace better, that you’re not investing in companies that are harming the planet, and that while they cost a little more you can still outperform over the long-term and avoid the risk of investing in companies that could go under, I think they will be on board,” Etus says.
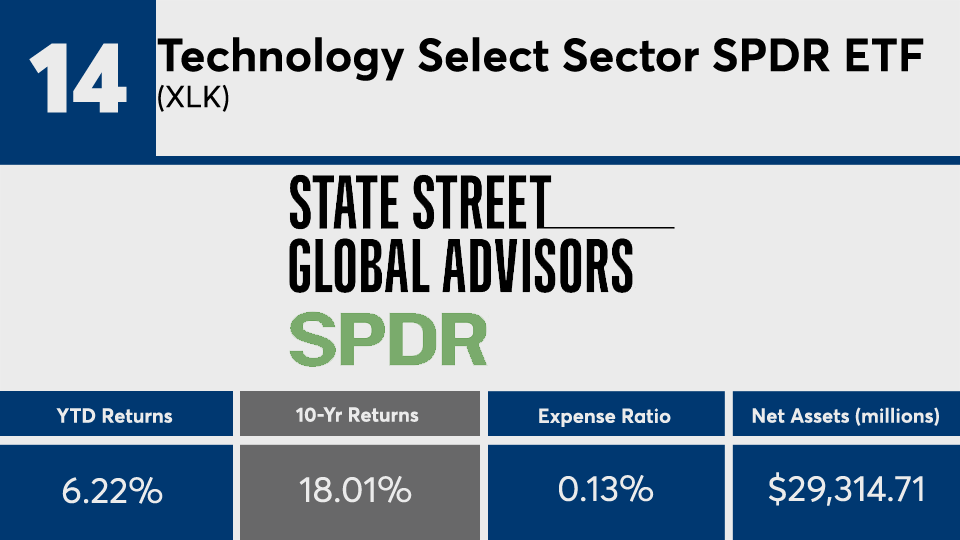
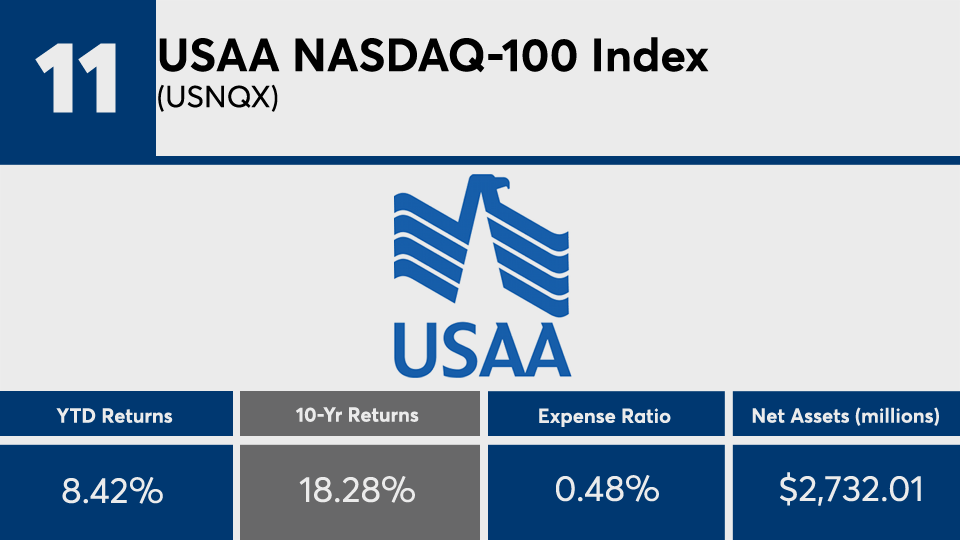
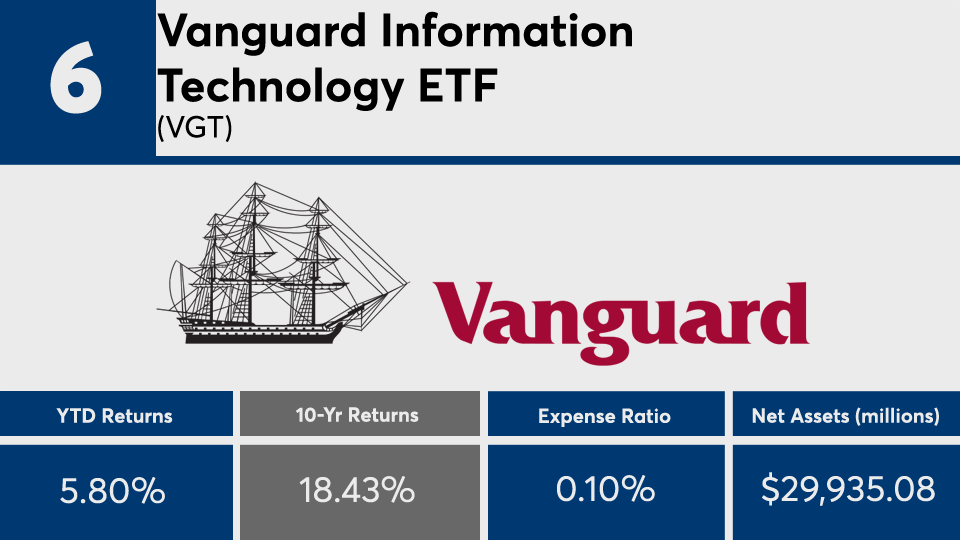
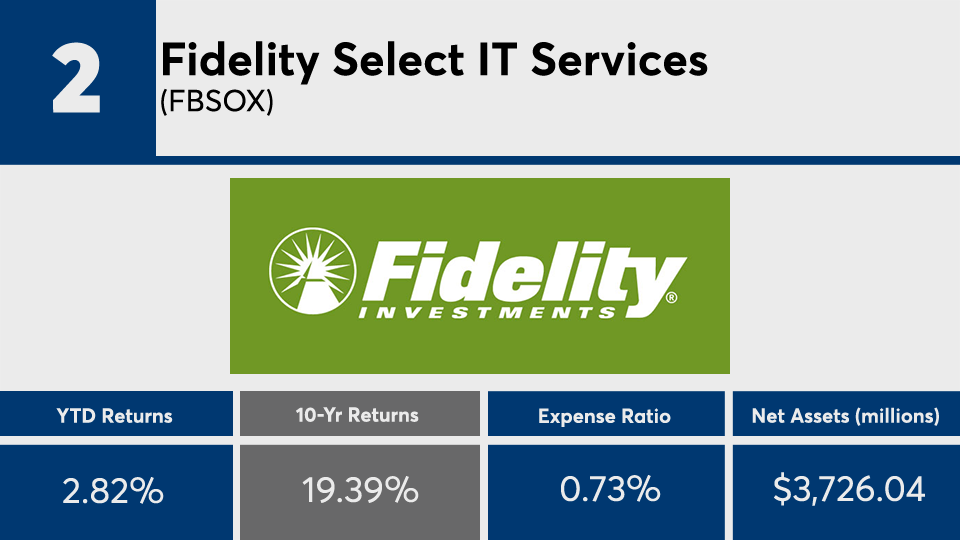
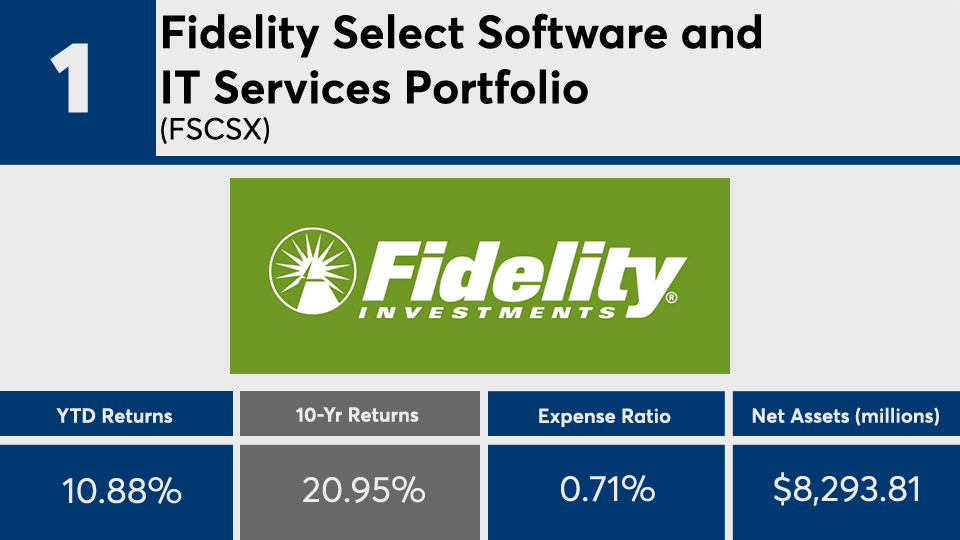
Scroll through to see the 20 mutual funds and ETFs with an above-average or higher Morningstar Sustainability Rating with the best 10-year returns through May 20. Funds with less than $500 million in AUM and with investment minimums over $100,000 were excluded, as were leveraged and institutional funds. Assets and expense ratios, as well as year-to-date and one-, three-, five- and 10-year returns are listed for each. The data show each fund's primary share class. All data is from Morningstar Direct.


