20 biggest U.S. fund families post $65B in outflows in the year of coronavirus

The biggest fund families reported tens of billions of dollars in outflows in the first half of a year roiled by coronavirus-driven market volatility.

From January through May, 12 of the 20 largest U.S. fund families reported net outflows from mutual funds and ETFs of approximately $154 billion in combined assets under management, according to Morningstar Direct.

Eight reported net inflows of $89 billion through June 1.

“The passive game and the low fees have been gathering the lion's share of assets over the last three years,” says Marc Pfeffer, CIO of CLS Investments.

To be sure, half of the 20 biggest fund families reported net outflows from their actively managed products while just six reported outflows from passive, according to Morningstar data. Those with net inflows, however, managed to accumulate more net cash for active than passive.

Many clients “are starting to get fed up with fees,” Pfeffer says. “If you're going to buy an S&P 500 fund, why not just go with the cheapest? But if you're looking at active management, you need to look at more than just expense ratios.”

The largest fund family, Vanguard, reported net U.S. assets of more than $5 trillion, data show. The firm, which has seen the biggest net inflows of the largest fund families, has also experienced net inflows to both its passive and active lineups this year of $4 billion and $3.5 billion, respectively.

For clients deciding where to park their long-term investments, advisors must stress a multilayer approach to analyzing their holdings, Pfeffer says.

“You have to look at the composition of funds, risk tolerance and whether or not the funds meet the goals that the client has,” Pfeffer says. “That should be taken into consideration above anything else — the expectations from the client must be met.”

Scroll through to see the 20 largest fund families by U.S. assets ranked by their year-to-date outflows through June 1. Active and passive flows are listed for all. The data excludes assets from money market funds and fund-of-funds. All data is from Morningstar Direct.

FP061920_20 copy.png

Vanguard

Total active flows (millions): $4,047.83
Total passive flows (millions): $3,478.17
FP061920_19 copy.png

iShares

Total active flows (millions): $324.76
Total passive flows (millions): $1,327.43
FP061920_18 copy.png

SPDR State Street Global Advisors

Total active flows (millions): ($105.59)
Total passive flows (millions): $6,902.90
FP061920_17 copy.png

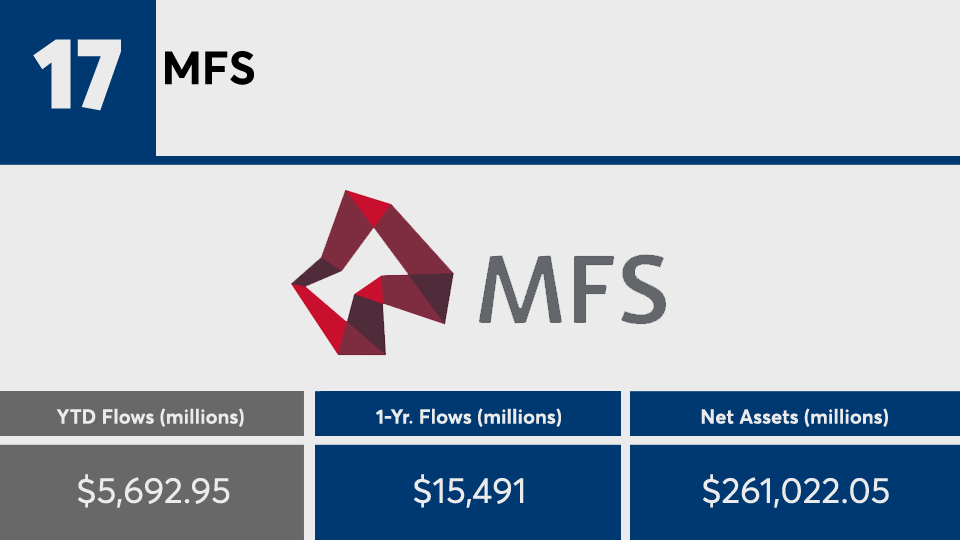
MFS

Total active flows (millions): $2,063.58
Total passive flows (millions): N/A
FP061920_16 copy.png

Schwab ETFs

Total active flows (millions): N/A
Total passive flows (millions): ($21.85)
FP061920_15 copy.png

BlackRock

Total active flows (millions): $4,256.30
Total passive flows (millions): ($238.74)
FP061920_14 copy.png

JPMorgan

Total active flows (millions): $6,170.17
Total passive flows (millions): ($108.15)
FP061920_13 copy.png

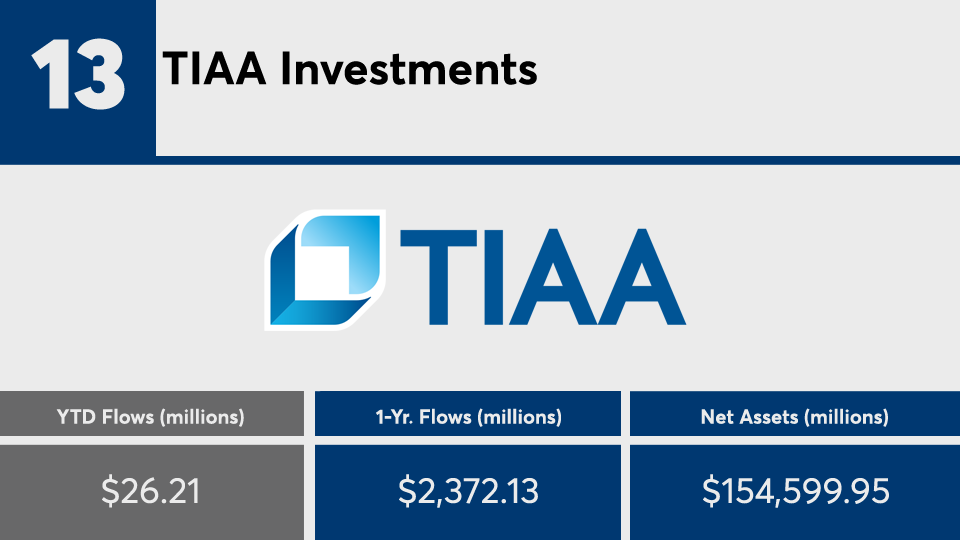
TIAA Investments

Total active flows (millions): ($363.07)
Total passive flows (millions): $736.45
FP061920_12 copy.png

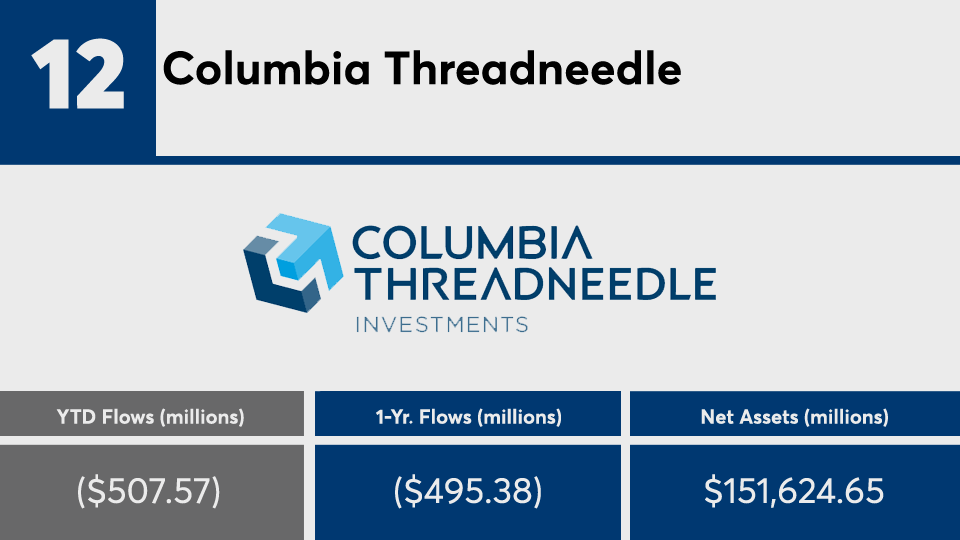
Columbia Threadneedle

Total active flows (millions): $1,202.70
Total passive flows (millions): ($81.94)
FP061920_11 copy.png

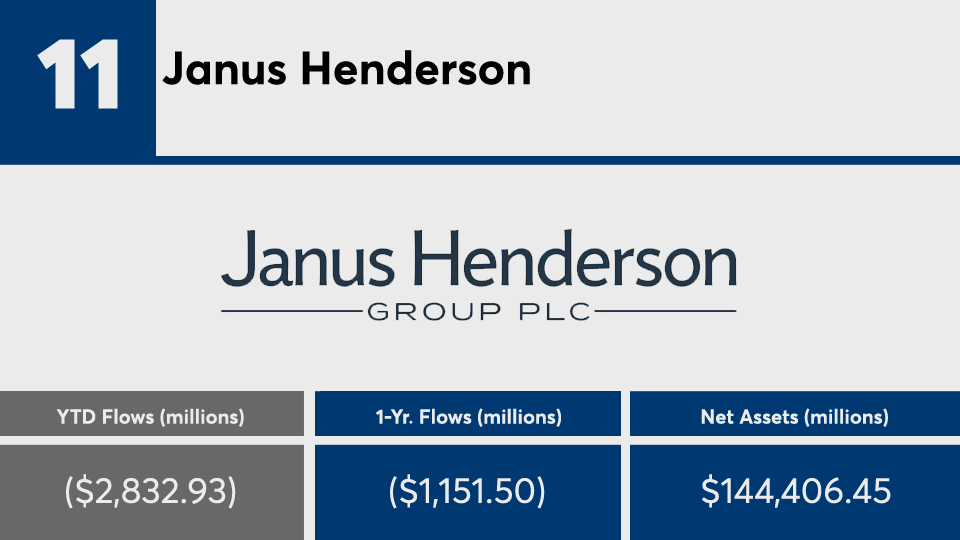
Janus Henderson

Total active flows (millions): ($403.95)
Total passive flows (millions): ($0.10)
FP061920_10 copy.png

Jackson National

Total active flows (millions): ($372.42)
Total passive flows (millions): $286.28
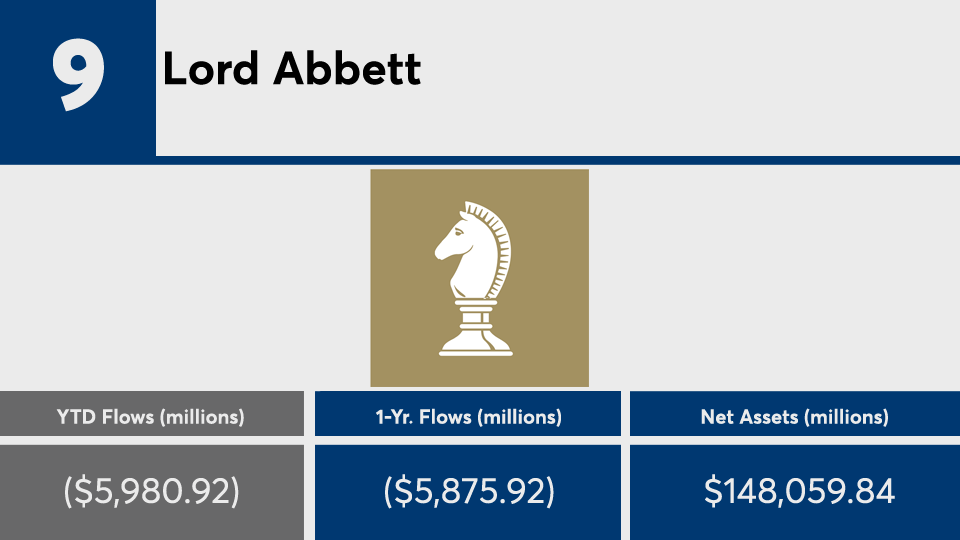
FP061920_9 copy.png

Lord Abbett

Total active flows (millions): $1,964.20
Total passive flows (millions): N/A
FP061920_8 copy.png

Dodge & Cox

Total active flows (millions): ($2,103.12)
Total passive flows (millions): N/A
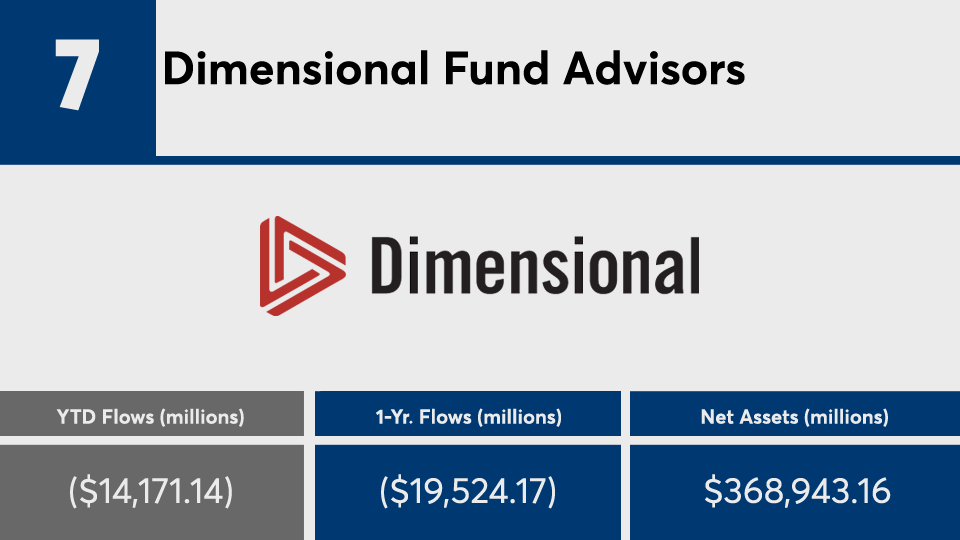
FP061920_7 copy.png

Dimensional Fund Advisors

Total active flows (millions): ($3,728.90)
Total passive flows (millions): ($69.21)
FP061920_6 copy.png

Franklin Templeton Investments

Total active flows (millions): ($1,704.32)
Total passive flows (millions): ($57.18)
FP061920_5 copy.png

American Funds

Total active flows (millions): $1,606.17
Total passive flows (millions): N/A
FP061920_4 copy.png

Pimco

Total active flows (millions): $2,817.45
Total passive flows (millions): ($5)
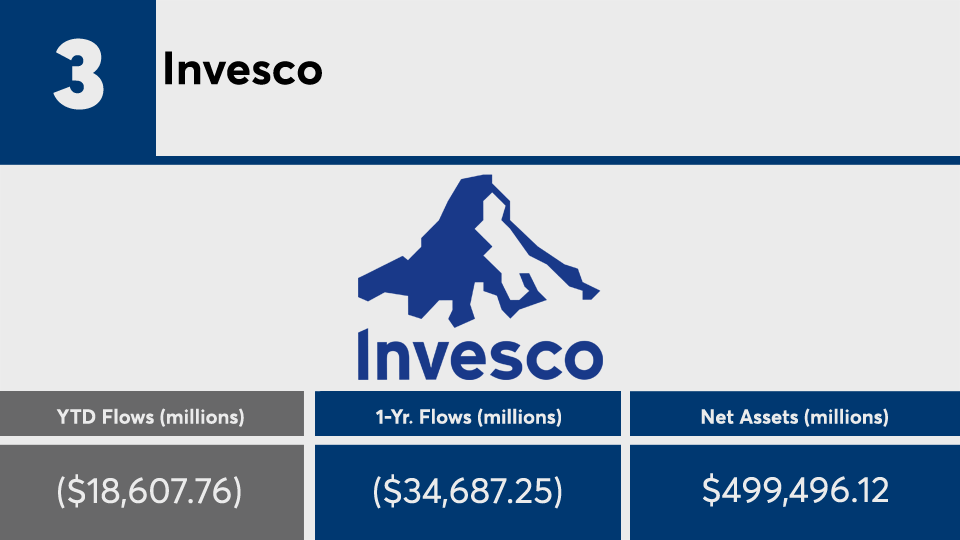
FP061920_3 copy.png

Invesco

Total active flows (millions): ($2,811.09)
Total passive flows (millions): $3,389.18
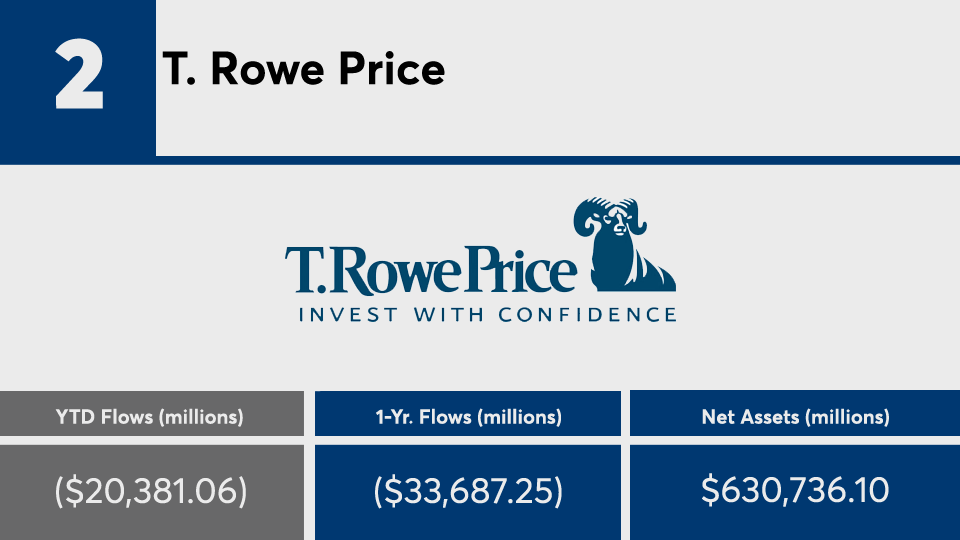
FP061920_2 copy.png

T. Rowe Price

Total active flows (millions): ($702.83)
Total passive flows (millions): ($1,314.10)
FP061920_1 copy.png

Fidelity Investments

Total active flows (millions): ($1,051.68)
Total passive flows (millions): $2,124.66
MORE FROM FINANCIAL PLANNING