In the fund industry, the tide of popularity has steadily flowed to low-cost, passively managed products, and away from pricier stock pickers. So too have the gains.
With an average 10-year return of more than 18%, the industry’s best-performing actively managed products have underperformed over the last year, according to data from Morningstar Direct. Active funds with the biggest 10-year returns posted an average gain of less than 7% in the past year, with some even recording losses. This, says Greg McBride, chief financial analyst at Bankrate, is a great anecdote for advisors to use with clients on how past performance is no guarantee of future results.
“The winning sectors of the past decade had some common themes — technology and health sciences,” McBride says. "What did best the past 10 years is unlikely to prevail in the next 10 years.”
Carrying a combined $129.2 billion in AUM, the actively managed products with the biggest gains over 10 years are part of a segment of the fund industry that has seen its popularity dissipate. At $4.246 trillion,
As expected, fees among the top-performing active funds were higher than what investors paid on average last year. At 84 basis points, the top-performing active product was more than 40 basis points higher than the 0.48% investors paid on average for fund investing, according to Morningstar’s most recent annual fee survey, which reviewed the asset-weighted average expense ratios of all U.S. open-end mutual funds and ETFs. With $191.1 billion in assets under management and a 0.62% net expense ratio, the industry’s largest active fund, the American Funds Growth Fund of America (AGTHX), has an average 10-year return of 12.77% and one-year return of just 1.34%, data show.
“The top performing active funds had higher expenses than index funds — as to be expected — but not egregiously so,” McBride says. “The strong performance of these funds in relatively concentrated segments of the market was enough to outpace the returns of broader index funds.”
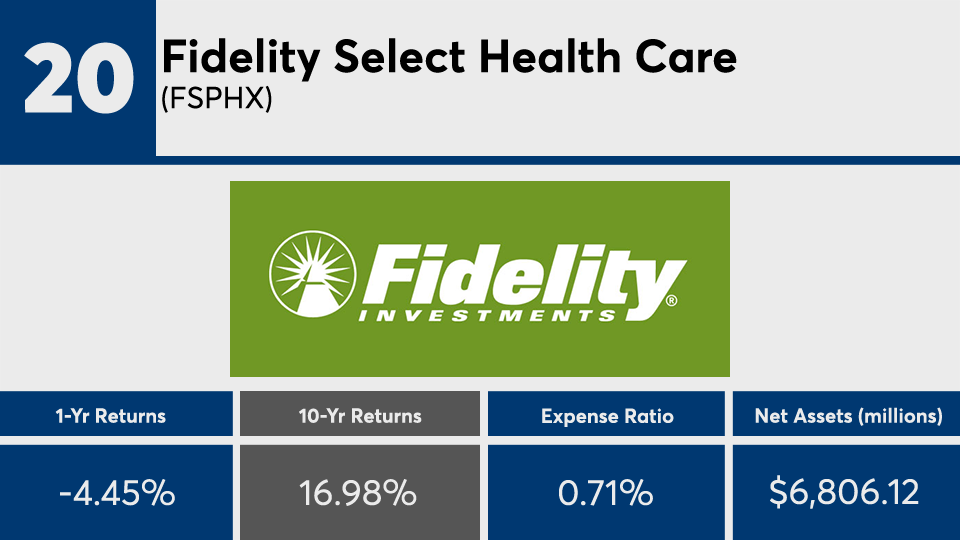
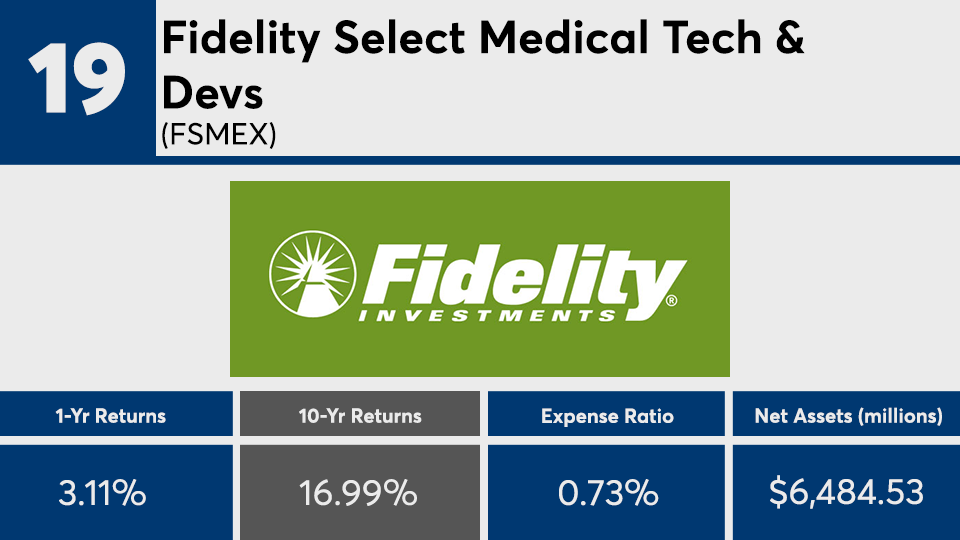
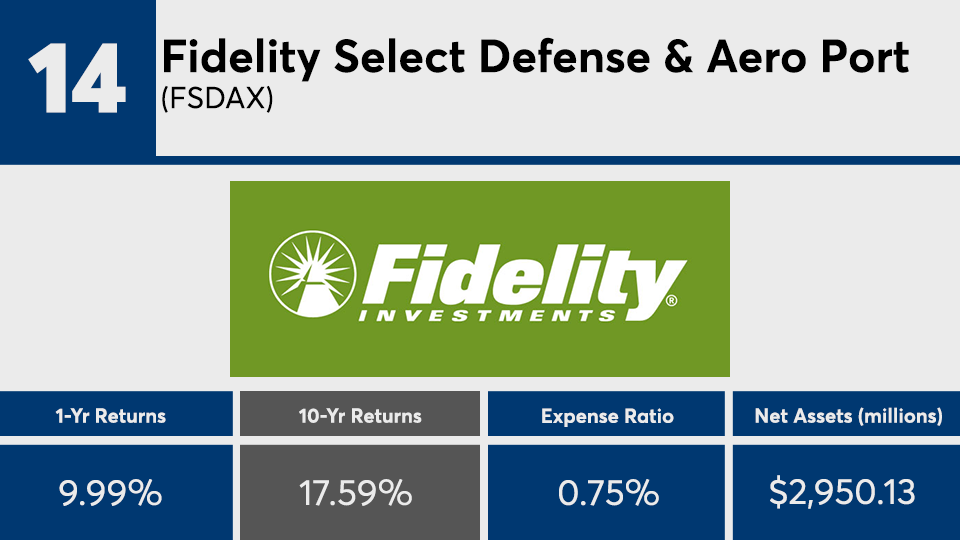
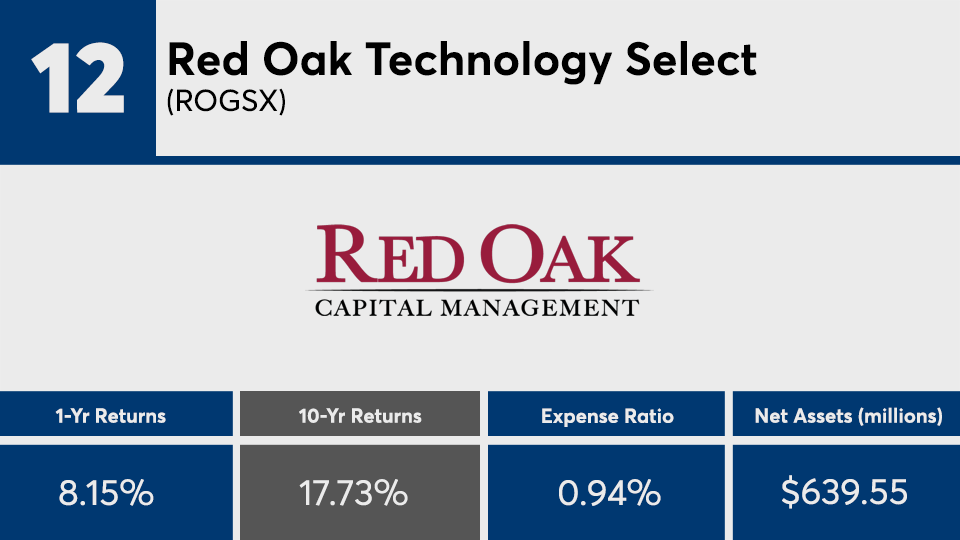
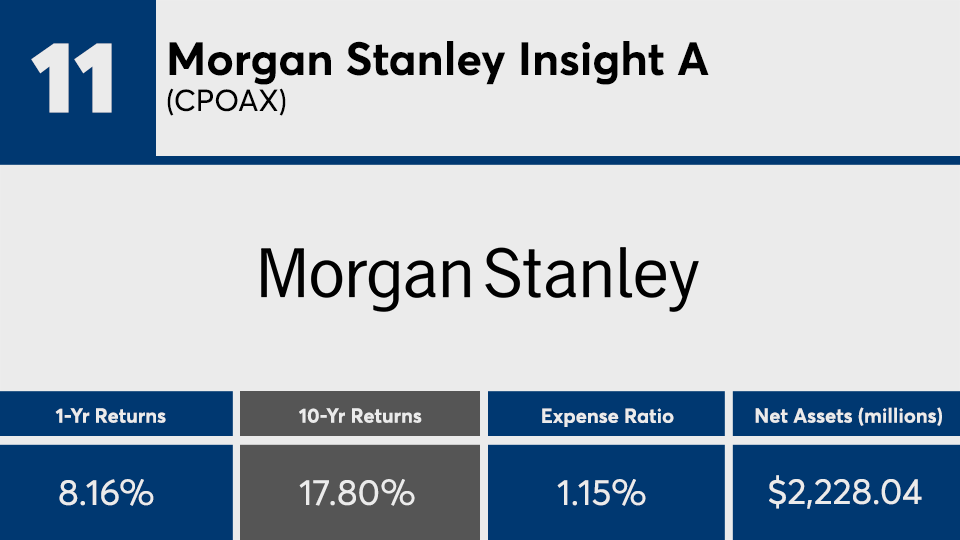
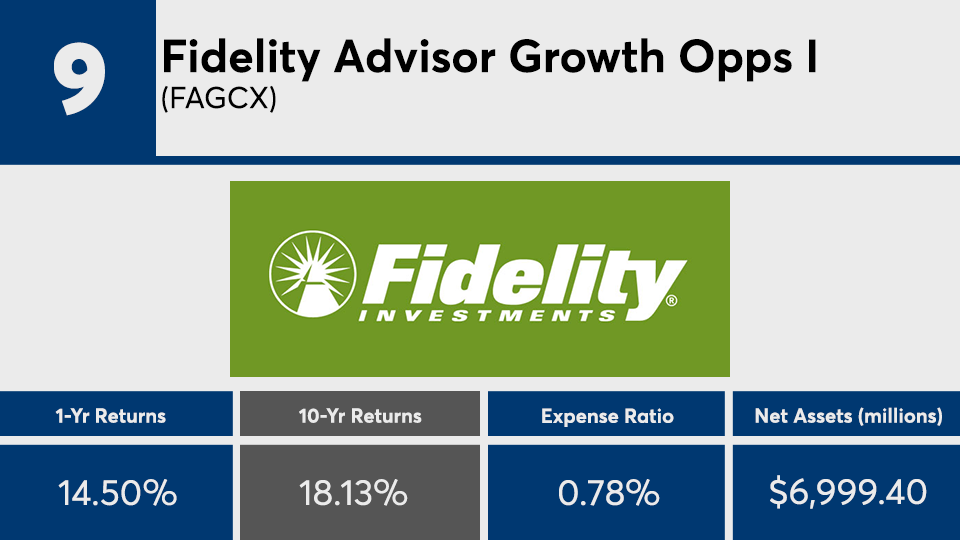
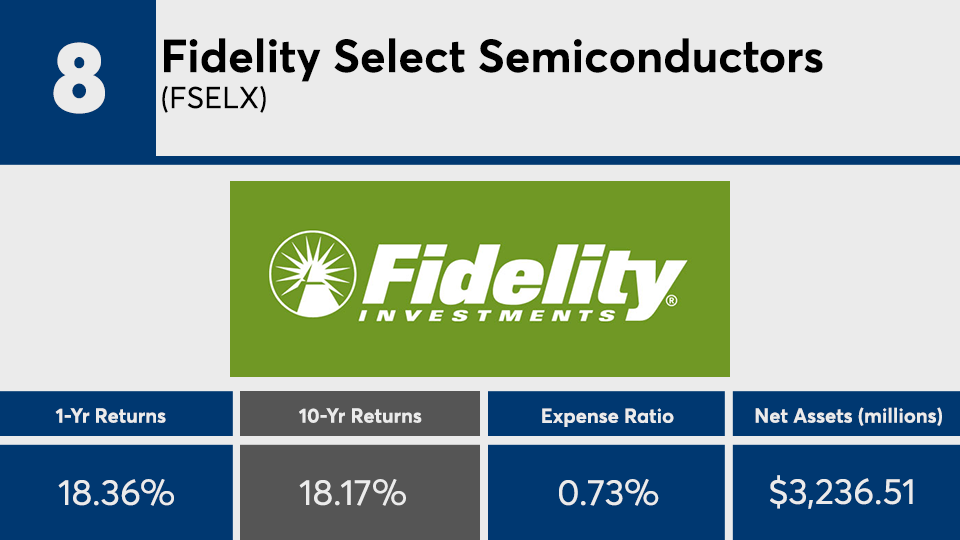
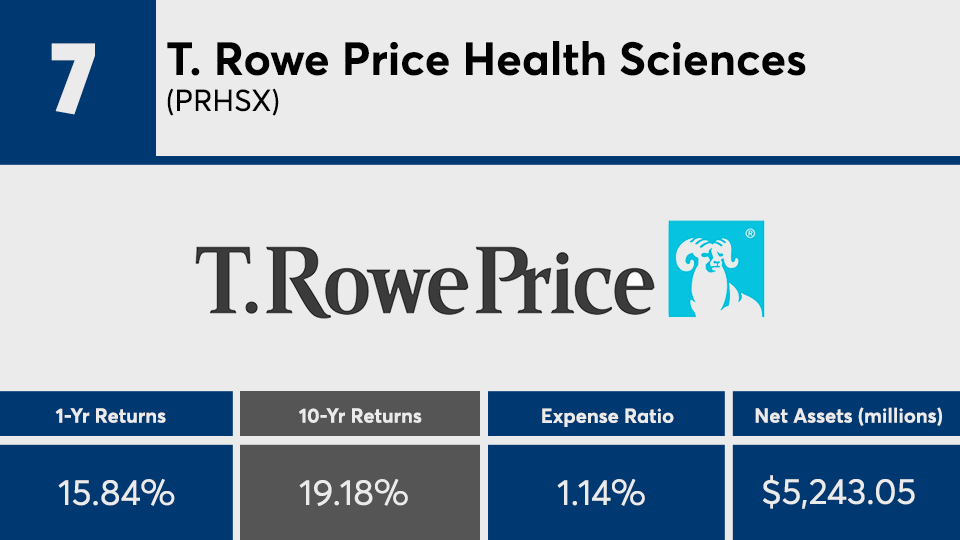
Scroll through to see the 20 top-performing actively managed funds (with at least $500 million in assets under management) ranked by 10-year annualized returns through Sept. 13. Funds with investment minimums over $100,000 were excluded, as were leveraged and institutional funds. Assets and expense ratios for each, as well as one-year daily returns, are also listed. The data shows each fund's primary share class. All data from Morningstar Direct.
