ESG

ESG funds with the biggest 10-year returns

Sustainable investing is not just an attractive approach for clients looking to inject ESG into their retirement portfolios. The strategy is also a growing one that now delivers broader outperformance.

The 20 best-performing Morningstar-designated sustainable U.S. funds, which either claim to have a sustainability objective or use ESG criteria for their investment selection, notched an average gain of more than 17% over the decade, data show. Over the past 12 months, the same funds had an average return of 33.7%.

With asset growth up from the end of the first quarter by more than $2.25 trillion in the space, or more than 12% according to Morningstar’s Q2 global sustainability report, this overall outperformance should be no surprise, explained Earth Equity Advisors CEO Peter Krull, who pointed to a shift in global priorities for their success.

“By focusing on sustainability, we are able to potentially outperform the benchmark because the benchmark is comprised of the legacy economy, while sustainability focused funds are looking forward to a new economy,” Krull said, adding that “investing in positive, solutions-oriented companies, focused on sustainability is where the market is going and where investors will excel going forward.”

To be sure, index trackers such as the SPDR S&P 500 ETF Trust (SPY) and SPDR Dow Jones Industrial Average ETF (DIA) delivered 10-year returns of 16.26% and 14.47%, respectively, data show. Over the past year, the funds had gains of 33.55% and 27.97%. In bonds, the iShares Core U.S. Aggregate Bond ETF (AGG) had a 10-year return of 2.94% and one-year loss of 1.21%, data show.

“ESG is a tool of measurement. It is not, and should not be the end product," said Earth Equity Advisors CEO Peter Krull.

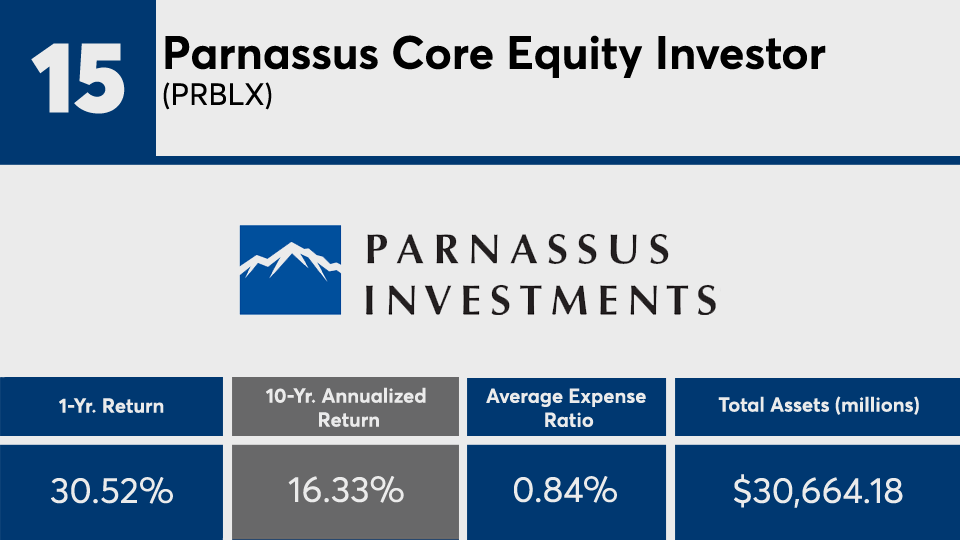
The largest fund on Morningstar’s sustainable fund last quarter, the $30.9 billion Parnassus Core Equity Investor (PRBLX), posted one- and 10-year gains of 30.52% and 16.33%.

To be a part of the strategy, however, advisors and clients must consider the fees associated with the sector’s best performers. With an average net expense ratio of more than 71 basis points, the funds in this ranking are significantly more expensive than the 0.41% asset-weighted average expense ratio across all funds in 2020, according to Morningstar’s latest fee study.

In addition to their cost, there are many other factors to consider when discussing sustainable investing with clients. Also on the checklist, Krull said, is understanding the difference between ESG and SRI (sustainable, responsible and impact investing).

“ESG is a tool of measurement. It is not, and should not be the end product,” Krull explained. “There are too many opportunities for greenwashing using only ESG ratings, which vary widely by provider. ESG ratings should help an advisor build an SRI portfolio.”

Without popping the hood and analyzing a fund’s management priorities and holdings, it is easy to miss the mark, Krull said.

“Many include companies such as ExxonMobil, McDonalds, Facebook and Raytheon,” Krull said of many funds rated well for overall sustainability. “Clients are expecting advisors to conduct due diligence to avoid greenwashing and buy funds that invest in companies making a positive difference. Don’t just rely on the name of a fund and assume it’s a sustainable fund.”

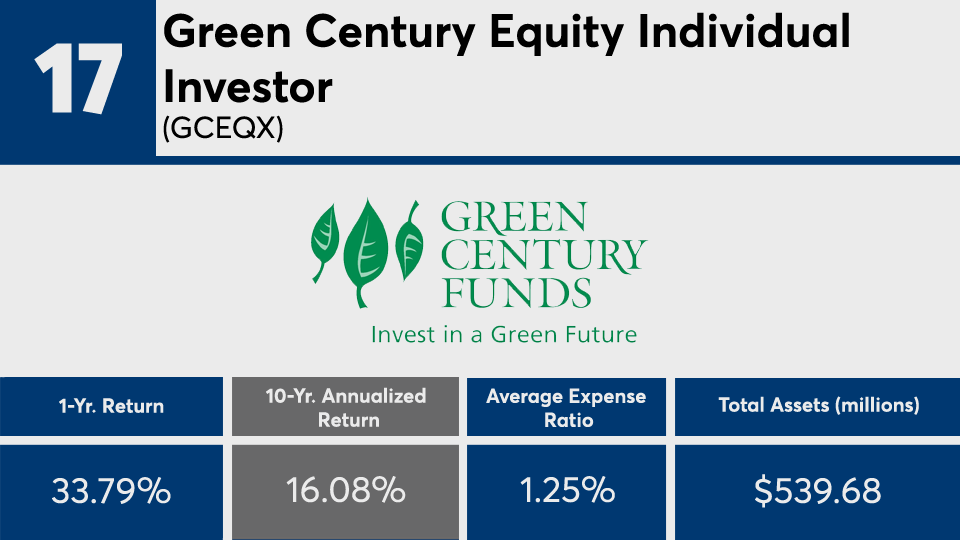
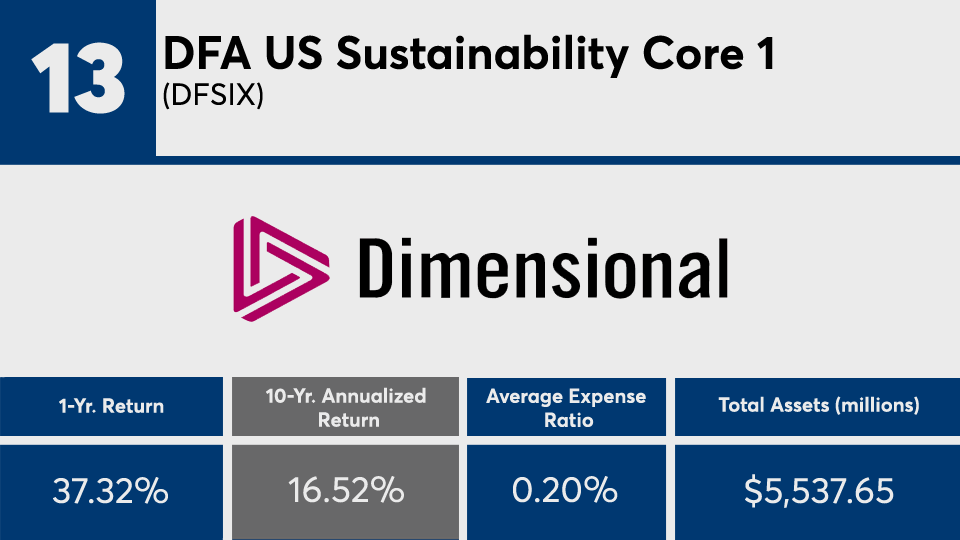
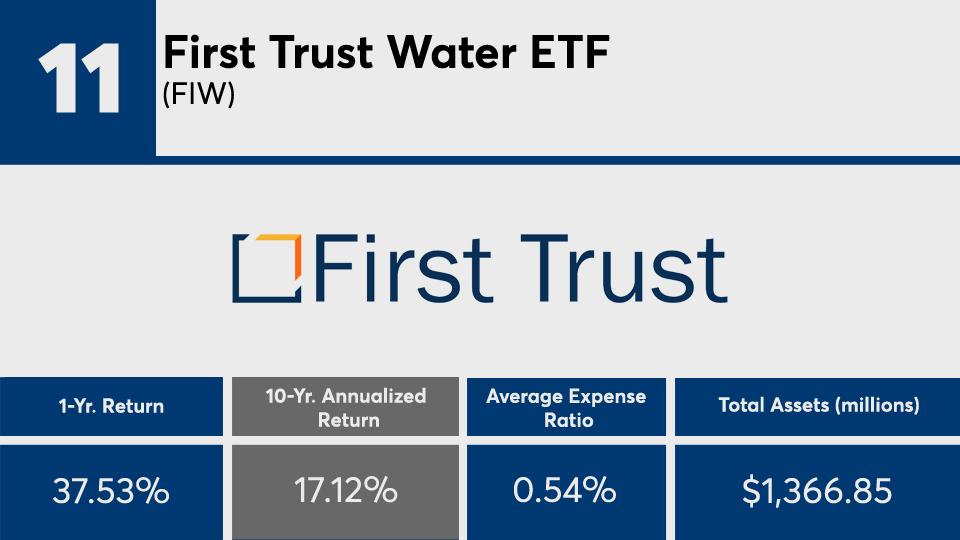
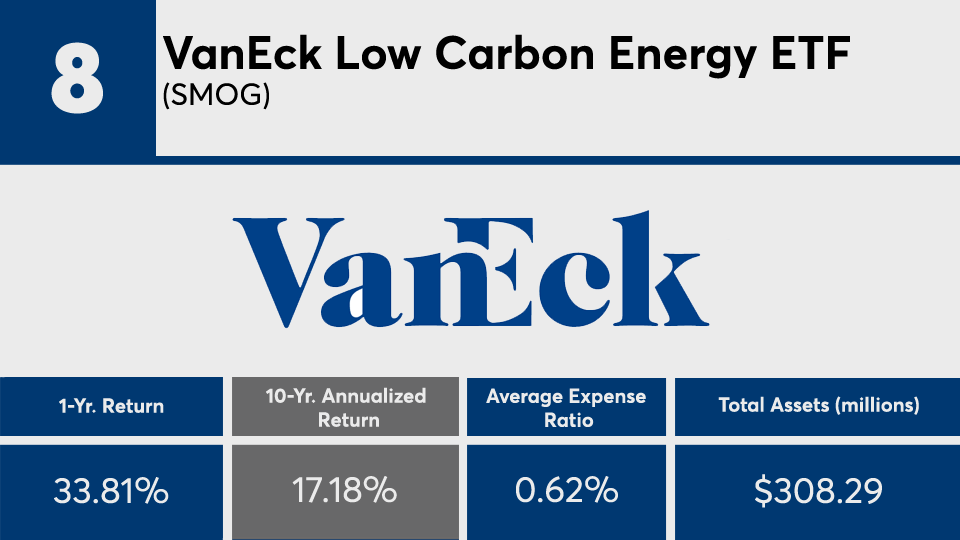
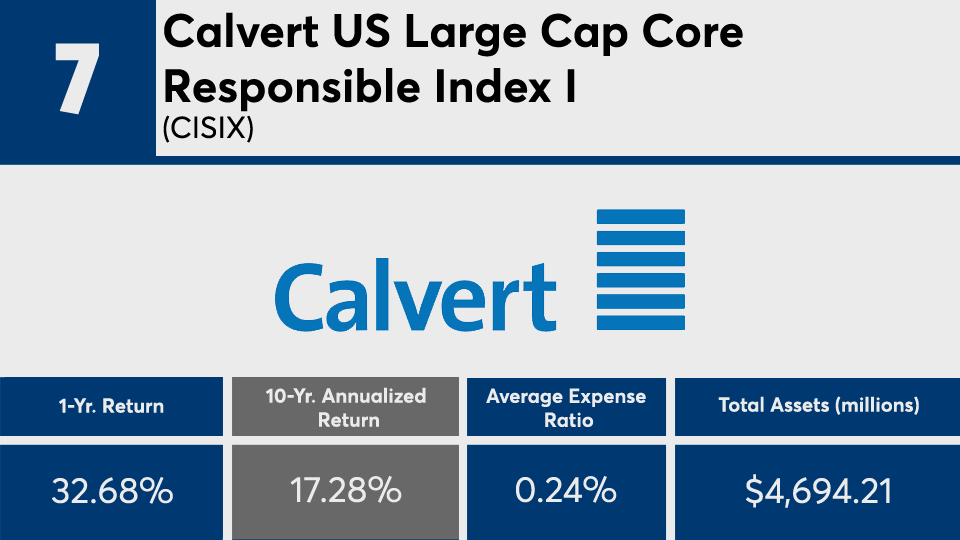
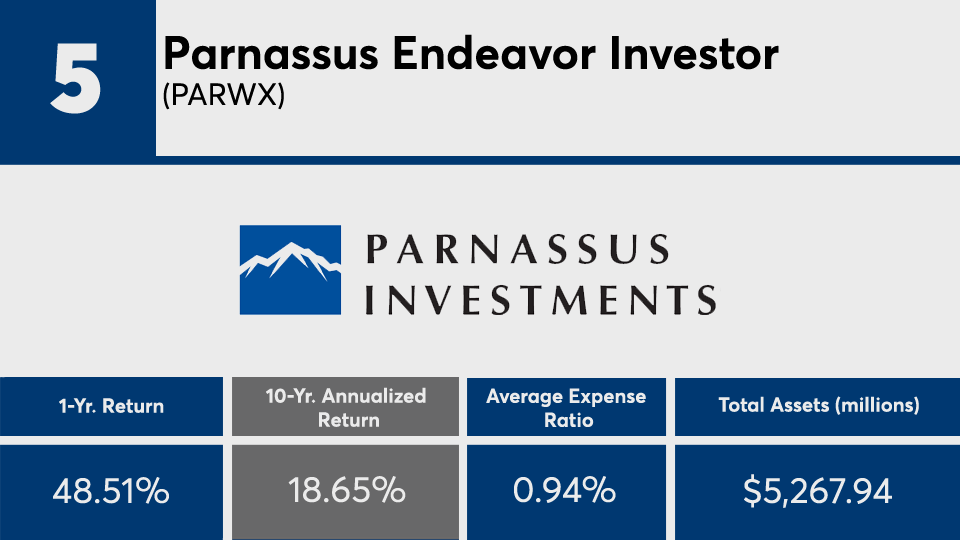
Scroll through to see the 20 Morningstar-designated sustainable U.S. mutual funds and ETFs with the biggest 10-year returns, and at least $100 million in AUM, through Oct. 21. Net expense ratios, loads, investment minimums, and manager names, as well as YTD, one-, three-, five- and 15-year returns and month-end share class flows through May 1 are also listed. The data show each fund's primary share class. Leveraged, institutional and funds with investment minimums over $100,000 have been excluded. All data is from Morningstar Direct.

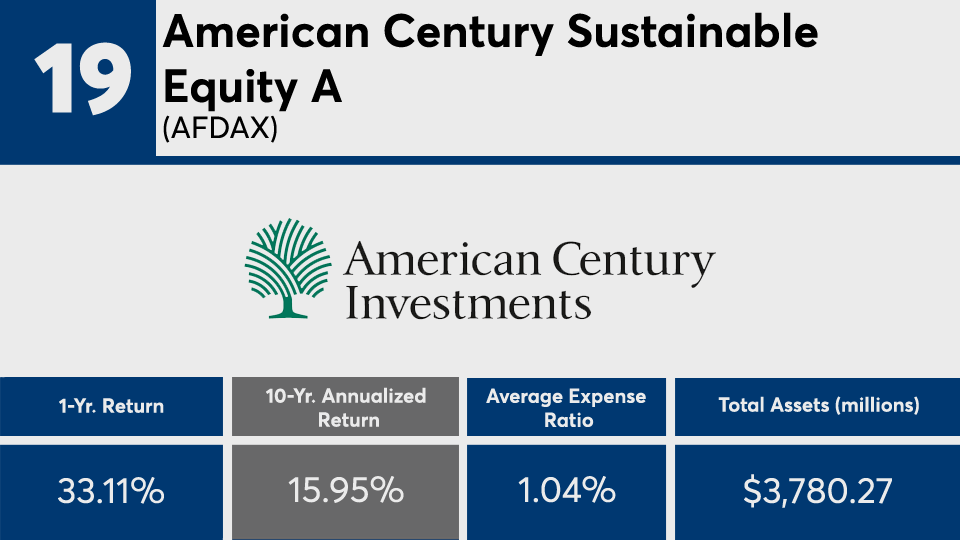
FP102221_20 copy.png
YTD Return: 22.85%; 3-Yr. Annualized Return: 33.16%; 5-Yr. Annualized Return: 21.92%; 15-Yr. Annualized Return: N/A; YTD Net Flow: (millions): $384.83; 1-Yr. Net Flow (millions): $442.47; 3-Yr. Net Flow (millions): $456.37; 5-Yr. Net Flow (millions): $472.22; 10-Yr. Net Flow (millions): $461.60; 15-Yr. Net Flow (millions): N/A; Inception Date: Nov. 16, 2009; Manager Names: Roger F. Testin, Daniel J. Lindquist, Jon C. Erickson, David G. McGarel, Stan Ueland, Chris A. Peterson and Erik Russo
FP102221_19 copy.png
YTD Return: 22.14%; 3-Yr. Annualized Return: 20.98%; 5-Yr. Annualized Return: 19.03%; 15-Yr. Annualized Return: 10.84%; YTD Net Flow: (millions): $12.99; 1-Yr. Net Flow (millions): $14.63; 3-Yr. Net Flow (millions): $5.94; 5-Yr. Net Flow (millions): ($62.44); 10-Yr. Net Flow (millions): ($136.55); 15-Yr. Net Flow (millions): ($3.15); Minimum Initial Investment: $2,500; Front Load: 5.75%; Inception Date: Nov. 30, 2004; Manager Names: Joseph Reiland, Justin M. Brown and Robert J Bove
FP102221_18 copy.png
YTD Return: 24.04%; 3-Yr. Annualized Return: 23.65%; 5-Yr. Annualized Return: 19.63%; 15-Yr. Annualized Return: 10.39%; YTD Net Flow: (millions): $942.57; 1-Yr. Net Flow (millions): $1,269.93; 3-Yr. Net Flow (millions): $1,912.11; 5-Yr. Net Flow (millions): $2,109.55; 10-Yr. Net Flow (millions): $2,251.63; 15-Yr. Net Flow (millions): $2,355.59; Inception Date: Jan. 24, 2005; Manager Names: Greg Savage, Jennifer Hsui, Alan Mason and Amy Whitelaw
FP102221_17 copy.png
YTD Return: 22.87%; 3-Yr. Annualized Return: 22.57%; 5-Yr. Annualized Return: 19.08%; 15-Yr. Annualized Return: 10.14%; YTD Net Flow: (millions): ($9.57); 1-Yr. Net Flow (millions): ($19.23); 3-Yr. Net Flow (millions): ($37.26); 5-Yr. Net Flow (millions): ($51.15); 10-Yr. Net Flow (millions): $30.82; 15-Yr. Net Flow (millions): $46.68; Minimum Initial Investment: $2,500; Redemption Load: 2%; Inception Date: Sept. 13, 1996; Manager Name: Brent D. Reeder
FP102221_16 copy.png
YTD Return: 24.51%; 3-Yr. Annualized Return: 22.52%; 5-Yr. Annualized Return: 19.13%; 15-Yr. Annualized Return: N/A; YTD Net Flow: (millions): $349.68; 1-Yr. Net Flow (millions): $553.61; 3-Yr. Net Flow (millions): $1,120.05; 5-Yr. Net Flow (millions): $1,486.01; 10-Yr. Net Flow (millions): $1,823.34; 15-Yr. Net Flow (millions): N/A; Inception Date: Nov. 14, 2006; Manager Names: Greg Savage, Jennifer Hsui, Alan Mason and Amy Whitelaw
FP102221_15 copy.png
YTD Return: 20.45%; 3-Yr. Annualized Return: 21.6%; 5-Yr. Annualized Return: 18.29%; 15-Yr. Annualized Return: N/A; YTD Net Flow: (millions): $227.44; 1-Yr. Net Flow (millions): $393.69; 3-Yr. Net Flow (millions): ($833.19); 5-Yr. Net Flow (millions): ($4,166.11); 10-Yr. Net Flow (millions): ($1,055.97); 15-Yr. Net Flow (millions): N/A; Minimum Initial Investment: $2,000; Inception Date: Aug. 31, 1992; Manager Names: Todd C. Ahlsten and Benjamin E. Allen
FP102221_14 copy.png
YTD Return: 10.06%; 3-Yr. Annualized Return: 18.84%; 5-Yr. Annualized Return: 15.82%; 15-Yr. Annualized Return: 11.29%; YTD Net Flow: (millions): ($40.39); 1-Yr. Net Flow (millions): ($59.95); 3-Yr. Net Flow (millions): ($292.35); 5-Yr. Net Flow (millions): ($383.98); 10-Yr. Net Flow (millions): ($426.25); 15-Yr. Net Flow (millions): ($361.12); Minimum Initial Investment: $2,000; Inception Date: Dec. 27, 1984; Manager Names: Ian E. Sexsmith and Robert J. Klaber
FP102221_13 copy.png
YTD Return: 22.29%; 3-Yr. Annualized Return: 20.78%; 5-Yr. Annualized Return: 18.89%; 15-Yr. Annualized Return: N/A; YTD Net Flow: (millions): $723.61; 1-Yr. Net Flow (millions): $828.35; 3-Yr. Net Flow (millions): $1,808.79; 5-Yr. Net Flow (millions): $2,413.45; 10-Yr. Net Flow (millions): $2,830.70; 15-Yr. Net Flow (millions): N/A; Inception Date: March 12, 2008; Manager Names: Jed S. Fogdall and Joel P. Schneider
FP102221_12 copy.png
YTD Return: 21.58%; 3-Yr. Annualized Return: 25.61%; 5-Yr. Annualized Return: 22.31%; 15-Yr. Annualized Return: 11.84%; YTD Net Flow: (millions): ($92.68); 1-Yr. Net Flow (millions): ($95.10); 3-Yr. Net Flow (millions): ($46.59); 5-Yr. Net Flow (millions): ($565.11); 10-Yr. Net Flow (millions): ($1,551.73); 15-Yr. Net Flow (millions): ($1,249.43); Minimum Initial Investment: $1,000; Front Load: 4.75%; Inception Date: Aug. 24, 1987; Manager Names: Joseph B. Hudepohl, Jeffrey A. Miller, Lance V. Garrison and Robert R. Walton
FP102221_11 copy.png
YTD Return: 23.43%; 3-Yr. Annualized Return: 24.47%; 5-Yr. Annualized Return: 20.3%; 15-Yr. Annualized Return: N/A; YTD Net Flow: (millions): $473.96; 1-Yr. Net Flow (millions): $525.82; 3-Yr. Net Flow (millions): $635.18; 5-Yr. Net Flow (millions): $766.08; 10-Yr. Net Flow (millions): $810.76; 15-Yr. Net Flow (millions): N/A; Inception Date: May 8, 2007; Manager Names: Roger F. Testin, Daniel J. Lindquist, Jon C. Erickson, David G. McGarel, Stan Ueland, Chris A. Peterson and Erik Russo
FP102221_10 copy.png
YTD Return: 14.94%; 3-Yr. Annualized Return: 27.91%; 5-Yr. Annualized Return: 19.85%; 15-Yr. Annualized Return: 10.76%; YTD Net Flow: (millions): ($13.83); 1-Yr. Net Flow (millions): ($24.85); 3-Yr. Net Flow (millions): ($94.48); 5-Yr. Net Flow (millions): ($167.80); 10-Yr. Net Flow (millions): ($437.81); 15-Yr. Net Flow (millions): ($577.87); Front Load: 5.75%; Inception Date: Nov. 1, 1999; Manager Names: Katherine Collins and Stephanie Dobson
FP102221_9 copy.png
YTD Return: 20.8%; 3-Yr. Annualized Return: 26.03%; 5-Yr. Annualized Return: 23.45%; 15-Yr. Annualized Return: 12.35%; YTD Net Flow: (millions): ($74.97); 1-Yr. Net Flow (millions): ($110.79); 3-Yr. Net Flow (millions): ($334.67); 5-Yr. Net Flow (millions): ($802.39); 10-Yr. Net Flow (millions): ($2,454.42); 15-Yr. Net Flow (millions): ($1,098.12); Minimum Initial Investment: $250; Inception Date: Feb. 3, 1994; Manager Names: Scott F. Klimo, Monem A. Salam and Christopher E. Paul
FP102221_8 copy.png
YTD Return: -1.04%; 3-Yr. Annualized Return: 45.3%; 5-Yr. Annualized Return: 26.52%; 15-Yr. Annualized Return: N/A; YTD Net Flow: (millions): $44.18; 1-Yr. Net Flow (millions): $70.94; 3-Yr. Net Flow (millions): N/A; 5-Yr. Net Flow (millions): N/A; 10-Yr. Net Flow (millions): N/A; 15-Yr. Net Flow (millions): N/A; Inception Date: May 3, 2007; Manager Name: Peter H. Liao and Guo Hua (Jason) Jin
FP102221_7 copy.png
YTD Return: 20.49%; 3-Yr. Annualized Return: 22.79%; 5-Yr. Annualized Return: 19.73%; 15-Yr. Annualized Return: 10.88%; YTD Net Flow: (millions): $315.77; 1-Yr. Net Flow (millions): $485.04; 3-Yr. Net Flow (millions): $1,044.27; 5-Yr. Net Flow (millions): $1,297.85; 10-Yr. Net Flow (millions): $1,588.54; 15-Yr. Net Flow (millions): $1,604.30; Minimum Initial Investment: $100,000; Inception Date: June 30, 2000; Manager Name: Thomas C. Seto
FP102221_6 copy.png
YTD Return: 20.58%; 3-Yr. Annualized Return: 24.82%; 5-Yr. Annualized Return: 22.41%; 15-Yr. Annualized Return: 11.65%; YTD Net Flow: (millions): ($276.07); 1-Yr. Net Flow (millions): ($386.19); 3-Yr. Net Flow (millions): ($1,057.33); 5-Yr. Net Flow (millions): ($1,703.04); 10-Yr. Net Flow (millions): ($3,226.11); 15-Yr. Net Flow (millions): ($5,476.84); Front Load: 5.75%; Inception Date: Aug. 31, 1990; Manager Names: Katherine Collins and Stephanie Dobson
FP102221_5 copy.png
YTD Return: 25.71%; 3-Yr. Annualized Return: 23.31%; 5-Yr. Annualized Return: 19.27%; 15-Yr. Annualized Return: 13.97%; YTD Net Flow: (millions): $740.84; 1-Yr. Net Flow (millions): $624.56; 3-Yr. Net Flow (millions): ($1,451.56); 5-Yr. Net Flow (millions): ($163.48); 10-Yr. Net Flow (millions): $810.48; 15-Yr. Net Flow (millions): $1,014.46; Minimum Initial Investment: $2,000; Inception Date: April 29, 2005; Manager Name: Billy J. Hwan
FP102221_4 copy.png
YTD Return: 22.89%; 3-Yr. Annualized Return: 27.41%; 5-Yr. Annualized Return: 24.81%; 15-Yr. Annualized Return: N/A; YTD Net Flow: (millions): ($11.48); 1-Yr. Net Flow (millions): ($376.20); 3-Yr. Net Flow (millions): ($372.83); 5-Yr. Net Flow (millions): ($529.43); 10-Yr. Net Flow (millions): ($452.77); 15-Yr. Net Flow (millions): N/A; Minimum Initial Investment: $100,000; Inception Date: May 15, 2009; Manager Names: Justin H. Kelly, Patrick M. Burton and Stephan C. Petersen
FP102221_3 copy.png
YTD Return: 22.57%; 3-Yr. Annualized Return: 25.44%; 5-Yr. Annualized Return: 22.75%; 15-Yr. Annualized Return: N/A; YTD Net Flow: (millions): $1.63; 1-Yr. Net Flow (millions): $9.63; 3-Yr. Net Flow (millions): $6.61; 5-Yr. Net Flow (millions): $20.36; 10-Yr. Net Flow (millions): $5.91; 15-Yr. Net Flow (millions): N/A; Minimum Initial Investment: $100,000; Inception Date: May 1, 2007; Manager Name: Dale Snyder
FP102221_2 copy.png
YTD Return: 14.14%; 3-Yr. Annualized Return: 29.58%; 5-Yr. Annualized Return: 25.97%; 15-Yr. Annualized Return: N/A; YTD Net Flow: (millions): $4.36; 1-Yr. Net Flow (millions): $11.63; 3-Yr. Net Flow (millions): ($8.00); 5-Yr. Net Flow (millions): ($50.60); 10-Yr. Net Flow (millions): $272.49; 15-Yr. Net Flow (millions): N/A; Minimum Initial Investment: $1,000; Inception Date: July 8, 2008; Manager Name: Finny Kuruvilla
FP102221_1 copy.png
YTD Return: -1.23%; 3-Yr. Annualized Return: 56.89%; 5-Yr. Annualized Return: 37.2%; 15-Yr. Annualized Return: N/A; YTD Net Flow: (millions): $922.21; 1-Yr. Net Flow (millions): $1,885.90; 3-Yr. Net Flow (millions): $2,161.22; 5-Yr. Net Flow (millions): $2,183.95; 10-Yr. Net Flow (millions): $2,208.42; 15-Yr. Net Flow (millions): N/A; Inception Date: Feb. 8, 2007; Manager Names: Roger F. Testin, Daniel J. Lindquist, Jon C. Erickson, David G. McGarel, Stan Ueland, Chris A. Peterson and Erik Russo
MORE FROM FINANCIAL PLANNING