Decade's top-performing actively managed funds with over $1B in AUM

For some of the industry’s biggest actively managed funds, neither market volatility sparked by the coronavirus pandemic nor the upcoming presidential election have deterred outsized gains.

The 20 top-performing active products with at least $1 billion in assets under management have generated an average 10-year annualized return of more than 20%, Morningstar Direct data show. Year-to-date, the same funds have an average gain of more than 45%.

By comparison, the SPDR S&P 500 ETF Trust (SPY) and the SPDR Dow Jones Industrial Average ETF Trust (DIA) posted 10-year returns of 13.69% and 12.52%, respectively. This year, the index trackers have generated returns of 9.47% and 1.64%.

In bonds, the AGG has generated gains of 6.75% and 3.55% over the YTD and 10-year periods.

It should be no surprise that some of the top-performers’ strategies are the antithesis of what led last week’s ranking of the worst-performing active funds with more than $1 billion in AUM, says Albert Brenner, director of asset allocation strategy at People’s United Advisors.

“Many of these funds are in growth, and growth stocks have so substantially outperformed value stocks — some of the differences are almost staggering,” Brenner says. “These are tracking the industries that are supporting the economy and will continue in the post-pandemic world.”

As expected, fees associated with the decade’s top-performing actively managed funds, most of which are in technology and growth sectors, are high. At 90 basis points, the funds on this list are twice that of the 0.45% investors paid on average for fund investing last year, according to Morningstar’s most recent annual fee survey.

For advisors speaking with clients, Brenner says that while it is important to discuss long-term returns, it is also vital to discuss how the short-term success of a fund can impact their annualized gains.

“If you try to imagine 10 years from now what segment of the economy, or sector, is going to be the one that will have the best economic and financial performance, we can sit here and look at the current topsy, turvy market and say, ‘It has got to be technology.’ Though you don't have to go back too far to a time when there was broad market consensus that it would have been the energy sector,” Brenner says. “I don't think you have to be completely agnostic about sector judgements, although I would have some degree of confidence that technology is probably going to do better than energy over the next 10 years. But it would be different to have such confidence to have all of my money in technology and none in energy.”

Scroll through to see the 20 actively managed funds with more than $1 billion in AUM and the best returns through Oct. 16. Funds with less than $100 million in AUM were excluded, as were leveraged and institutional funds. Assets and expense ratios, as well as YTD, one-, three- and five- returns are also listed for each. The data show each fund's primary share class. All data is from Morningstar Direct.

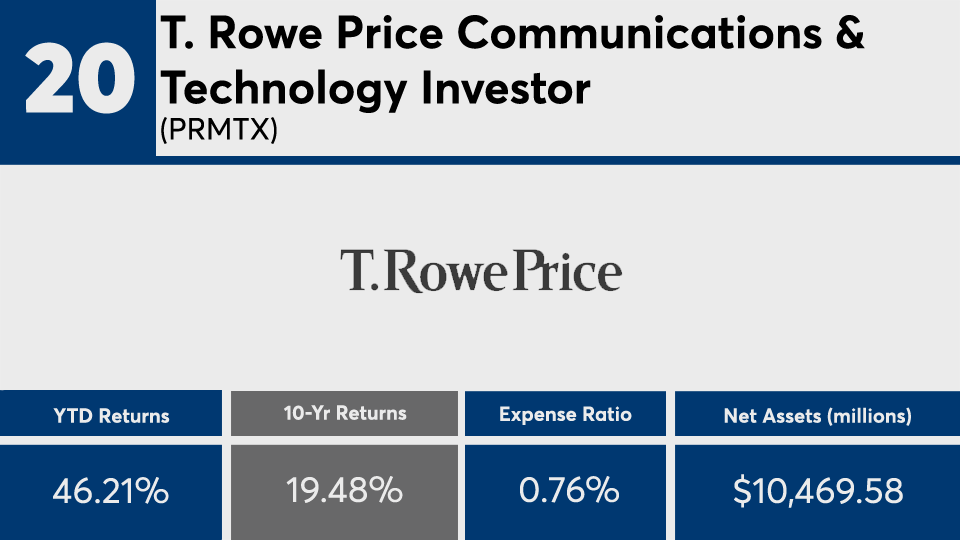
FP101920_20 copy.png

T. Rowe Price Communications & Technology Investor (PRMTX)

1-Yr. Return: 55.82%
3-Yr. Annualized Return: 25.49%
5-Yr. Annualized Return: 23.36%
FP101920_19 copy.png

Fidelity Select IT Services (FBSOX)

1-Yr. Return: 26.09%
3-Yr. Annualized Return: 22.98%
5-Yr. Annualized Return: 19.77%
FP101920_18 copy.png

Fidelity OTC (FOCPX)

1-Yr. Return: 48.5%
3-Yr. Annualized Return: 23.43%
5-Yr. Annualized Return: 22.38%
FP101920_17 copy.png

Fidelity Advisor Technology A (FADTX)

1-Yr. Return: 62.6%
3-Yr. Annualized Return: 27.4%
5-Yr. Annualized Return: 28.25%
Front Load: 5.75%
FP101920_16 copy.png

Fidelity Select Biotechnology (FBIOX)

1-Yr. Return: 48.01%
3-Yr. Annualized Return: 11.86%
5-Yr. Annualized Return: 8.98%
FP101920_15 copy.png

Fidelity Select Medical Technology and Devices (FSMEX)

1-Yr. Return: 37.67%
3-Yr. Annualized Return: 22.79%
5-Yr. Annualized Return: 21.83%
FP101920_14 copy.png

Fidelity Select Technology (FSPTX)

1-Yr. Return: 64.75%
3-Yr. Annualized Return: 27.63%
5-Yr. Annualized Return: 28.52%
FP101920_13 copy.png

Janus Henderson Global Technology and Innovation D (JNGTX)

1-Yr. Return: 52.96%
3-Yr. Annualized Return: 28.76%
5-Yr. Annualized Return: 28%
FP101920_12 copy.png

Fidelity Select Retailing (FSRPX)

1-Yr. Return: 35.5%
3-Yr. Annualized Return: 24.91%
5-Yr. Annualized Return: 18.87%
FP101920_11 copy.png

T. Rowe Price Health Sciences (PRHSX)

1-Yr. Return: 38.75%
3-Yr. Annualized Return: 16.49%
5-Yr. Annualized Return: 13.15%
FP101920_10 copy.png

Fidelity Growth Company (FDGRX)

1-Yr. Return: 70.96%
3-Yr. Annualized Return: 28.47%
5-Yr. Annualized Return: 25.02%
FP101920_09 copy.png

T. Rowe Price New Horizons (PRNHX)

1-Yr. Return: 54.04%
3-Yr. Annualized Return: 28.85%
5-Yr. Annualized Return: 24.06%
FP101920_08 copy.png

Fidelity Select Software & IT Services Portfolio (FSCSX)

1-Yr. Return: 44.75%
3-Yr. Annualized Return: 27.11%
5-Yr. Annualized Return: 25.5%
FP101920_07 copy.png

Baron Partners Retail (BPTRX)

1-Yr. Return: 110.77%
3-Yr. Annualized Return: 36.86%
5-Yr. Annualized Return: 28.71%
FP101920_06 copy.png

Fidelity Advisor Growth Opportunities I (FAGCX)

1-Yr. Return: 67.06%
3-Yr. Annualized Return: 36.38%
5-Yr. Annualized Return: 27.53%
FP101920_05 copy.png

Virtus Zevenbergen Innovative Growth Stock I (SCATX)

1-Yr. Return: 112.11%
3-Yr. Annualized Return: 44.89%
5-Yr. Annualized Return: 31.68%
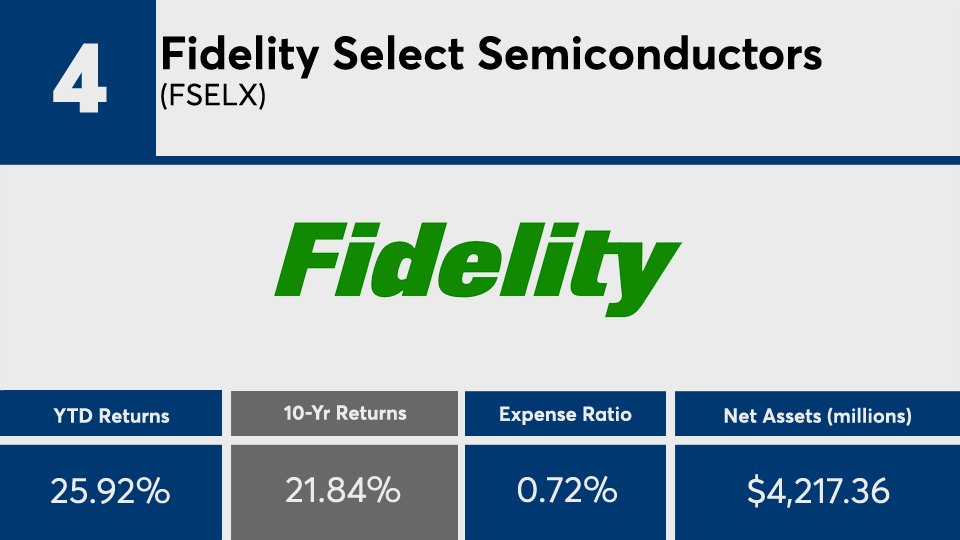
FP101920_04 copy.png

Fidelity Select Semiconductors (FSELX)

1-Yr. Return: 47.11%
3-Yr. Annualized Return: 25.5%
5-Yr. Annualized Return: 27.13%
FP101920_03 copy.png

Virtus KAR Small-Cap Growth I (PXSGX)

1-Yr. Return: 39.74%
3-Yr. Annualized Return: 29.39%
5-Yr. Annualized Return: 29.33%
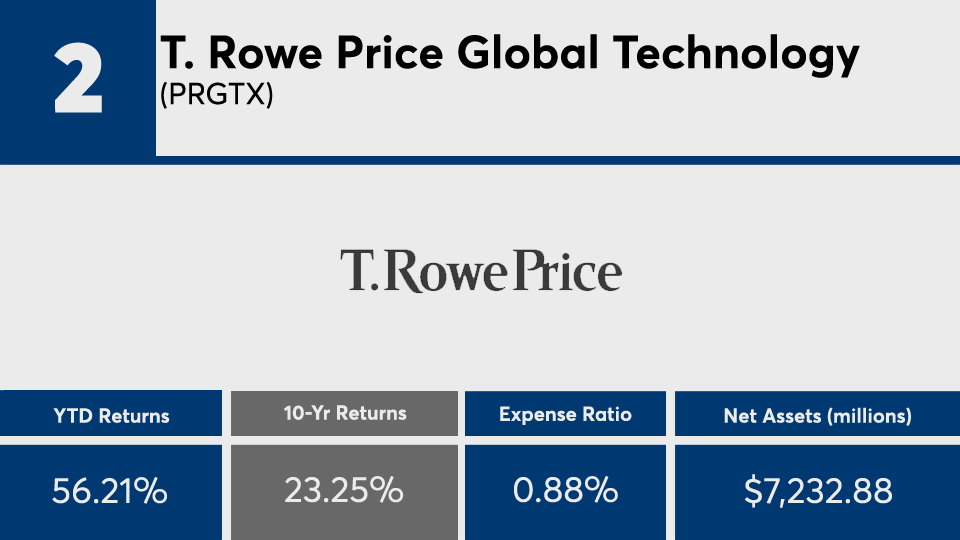
FP101920_02 copy.png

T. Rowe Price Global Technology (PRGTX)

1-Yr. Return: 67.16%
3-Yr. Annualized Return: 24.81%
5-Yr. Annualized Return: 26.19%
FP101920_01 copy.png

Morgan Stanley Insight A (CPOAX)

1-Yr. Return: 115.16%
3-Yr. Annualized Return: 48.41%
5-Yr. Annualized Return: 34.96%
Front Load: 5.75%
MORE FROM FINANCIAL PLANNING