Bond funds with the biggest net outflows YTD

Corporate credit took it on the nose at the end of the first quarter as investors flooded Treasury bond funds for some semblance of normalcy during the very abnormal coronavirus pandemic.

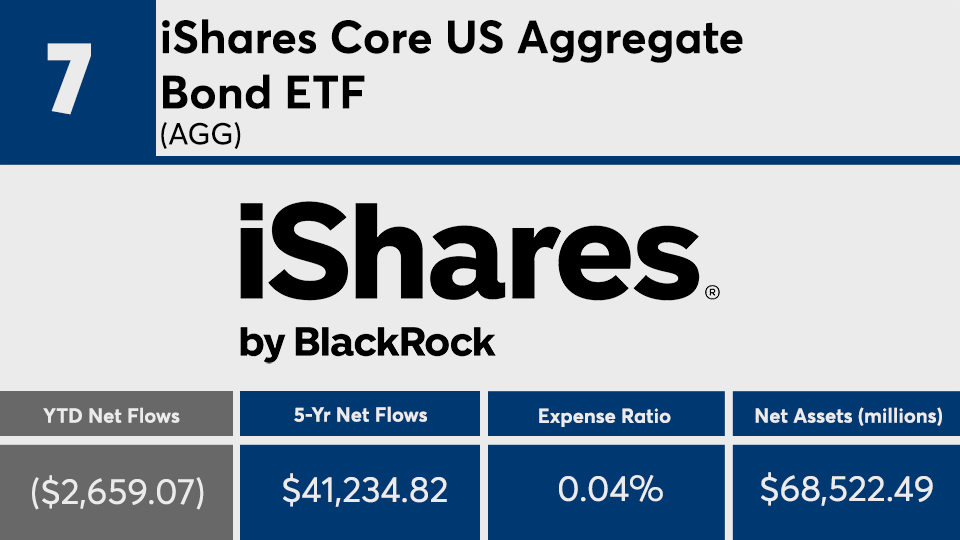
The 20 bond funds with the biggest net outflows so far this year, and at least $500 million in assets under management, have lost a combined $62.7 billion, Morningstar Direct data show. While some have posted double digit gains, these funds have recorded an average loss of 0.07%, well below the Bloomberg Barclays US Aggregate Bond Index’s 3.62% year-to-date return, as measured by the iShares Core US Aggregate Bond ETF (AGG). The funds have a combined $602.6 billion in AUM.

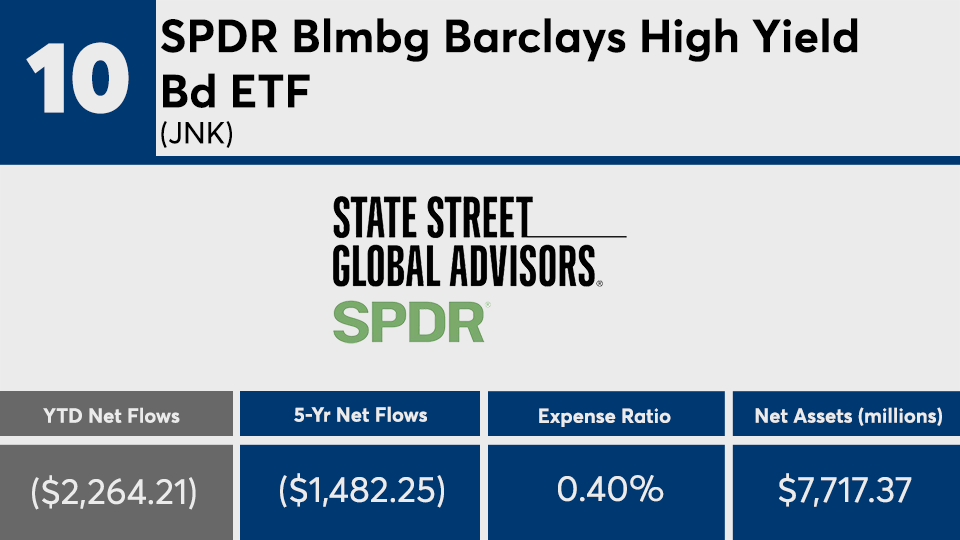
“It makes sense to see names like JNK, HYG and BKLN on this list experiencing outflows as investors ran from credit into the safety of Treasury mutual funds and ETFs in 2020, and in particular in March 2020," says Marc Pfeffer, CIO at CLS Investments. “Sometimes asset flows can be misinterpreted by investors in terms of what they should be doing. I find it surprising to see a Fidelity Treasury bond fund lose half of its assets when assets seem to be going in a major way into Treasurys, certainly into the ETF space. So, sometimes numbers have to be taken with a grain of salt.”

The industry’s largest bond fund, the $259.3 billion Vanguard Total Bond Market Index Admiral (VBTLX), recorded a net inflow of $2.8 billion and YTD return of 3.51%, data show. Over the longer term, the fund has generated a 10-year gain of 3.87%. In equities, the largest overall fund, the $736.7 billion Vanguard Total Stock Market Index Fund Admiral Shares (VTSAX), has a 0.14% expense ratio and has seen a net inflow of $30.5 billion with a YTD loss of 18.89% and 10-year gain of 10.26%, data show.

Though fees here are significantly higher than the 0.14% average from bond funds with the biggest net inflows, they were still lower than the rest of the industry. At an average of 28 basis points, these funds are far cheaper than the 0.48% investors paid on average for fund investing last year, according to Morningstar’s most recent annual fee survey, which reviewed the asset-weighted average expense ratios of all U.S. open-end mutual funds and ETFs.

“While it’s nice to have the information of fund flows, each individual investor needs to look at their own personal situation and risk tolerance, and make sure that it lines up with what their comfort level is,” Pfeffer says. “This market environment is a very good one for investors to do a self-awareness check to make sure that they are comfortable with the risk tolerance that they have on their investments and to make sure that they are lining up properly with how they believe they should be invested, and to not allow for an emotional toll.”

Scroll through to see the 20 fixed-income mutual funds and ETFs with the largest YTD share class outflows through April 1. Funds with less than $500 million in AUM and investment minimums over $100,000 were excluded, as were leveraged and institutional funds. Assets, expense ratios and five-year net share class flows are listed for each, as well as year-to-date, one-, three-, five- and 10-year returns. The data show each fund's primary share class. All data from Morningstar Direct.

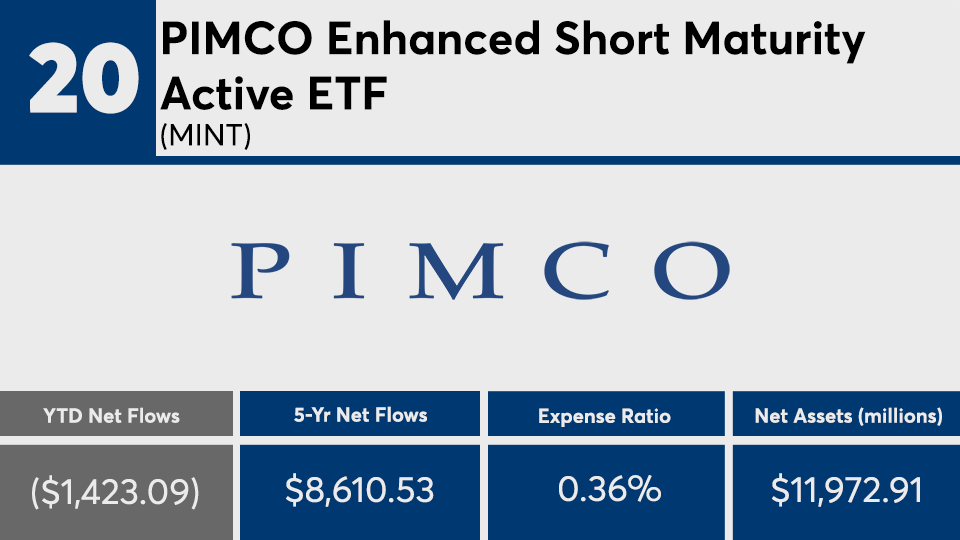
FP040820_20.png

PIMCO Enhanced Short Maturity Active ETF (MNT)

YTD Return: -1.61%
1-Yr. Return: 0.48%
3-Yr. Annualized Return: 1.55%
5-Yr. Annualized Return: 1.48%
10-Yr. Annualized Return: 1.32%
FP040820_19.png

Vanguard Short-Term-Investment-Grade Admiral (VFSUX)

YTD Return: -1.37%
1-Yr. Return: 2.20%
3-Yr. Annualized Return: 2.16%
5-Yr. Annualized Return: 2.02%
10-Yr. Annualized Return: 2.44%
FP040820_18.png

Invesco Senior Loan ETF (BKLN)

YTD Return: -9.27%
1-Yr. Return: -6.27%
3-Yr. Annualized Return: -0.02%
5-Yr. Annualized Return: 0.95
10-Yr. Annualized Return: N/A
FP040820_17.png

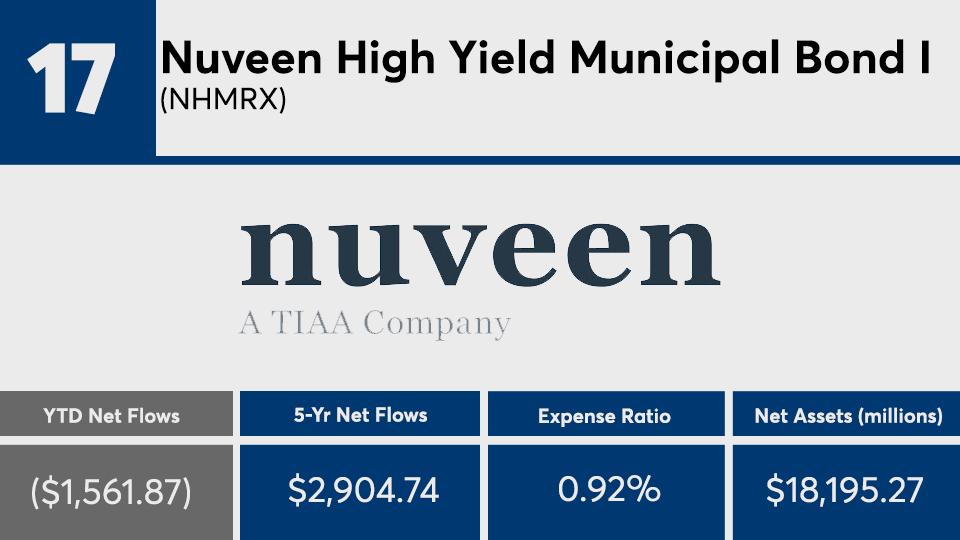
Nuveen High Yield Municipal Bond (NHMRX)

YTD Return: -12.51%
1-Yr. Return: -6.17%
3-Yr. Annualized Return: 2.72%
5-Yr. Annualized Return: 3.26%
10-Yr. Annualized Return: 6.29%
FP040820_16.png

iShares JP Morgan USD Emerging Markets Bond ETF (EMB)

YTD Return: -14.27%
1-Yr. Return: -7.90%
3-Yr. Annualized Return: -0.47%
5-Yr. Annualized Return: 1.83%
10-Yr. Annualized Return: 4.16%
FP040820_15.png

Lord Abbett Ultra Short Bond A (LUBAX)

YTD Return: -1.02%
1-Yr. Return: 0.86%
3-Yr. Annualized Return: 1.59%
5-Yr. Annualized Return: N/A
10-Yr. Annualized Return: N/A
FP040820_14.png

iShares iBoxx $ High Yield Corporate Bond ETF (HYG)

YTD Return: -13.87%
1-Yr. Return: -8.88%
3-Yr. Annualized Return: -0.02%
5-Yr. Annualized Return: 1.47%
10-Yr. Annualized Return: 4.54%
FP040820_13.png

American Funds US Government Securities R6 (RGVGX)

YTD Return: 8.28%
1-Yr. Return: 12.51%
3-Yr. Annualized Return: 5.10%
5-Yr. Annualized Return: 3.50%
10-Yr. Annualized Return: 3.75%
FP040820_12.png

Bridge Builder Core Bond (BBTBX)

YTD Return: 1.76%
1-Yr. Return: 8.01%
3-Yr. Annualized Return: 4.53%
5-Yr. Annualized Return: 3.43%
10-Yr. Annualized Return: N/A
FP040820_11.png

Fidelity Series Long-Term Treasury Bond Index (FTLTX)

YTD Return: 23.64%
1-Yr. Return: 37.14%
3-Yr. Annualized Return: 13.86%
5-Yr. Annualized Return: N/A
10-Yr. Annualized Return: N/A
FP040820_10.png

SPDR Blmbg Barclays High Yield Bd ETF (JNK)

YTD Return: -14.79%
1-Yr. Return: -9.78%
3-Yr. Annualized Return: -0.48%
5-Yr. Annualized Return: 0.92%
10-Yr. Annualized Return: 4.21%
FP040820_9.png

Vanguard Short-Term Corporate Bond ETF (VCSH)

YTD Return: -2.33%
1-Yr. Return: 1.80%
3-Yr. Annualized Return: 2.18%
5-Yr. Annualized Return: 2.02%
10-Yr. Annualized Return: 2.73%
FP040820_8.png

DoubleLine Total Return Bond I (DBLTX)

YTD Return: -0.85%
1-Yr. Return: 2.97%
3-Yr. Annualized Return: 2.99%
5-Yr. Annualized Return: 2.60%
10-Yr. Annualized Return: 5.59%
FP040820_7.png

iShares Core US Aggregate Bond ETF (AGG)

YTD Return: 3.19%
1-Yr. Return: 9.25%
3-Yr. Annualized Return: 4.69%
5-Yr. Annualized Return: 3.27%
10-Yr. Annualized Return: 3.86%
FP040820_6.png

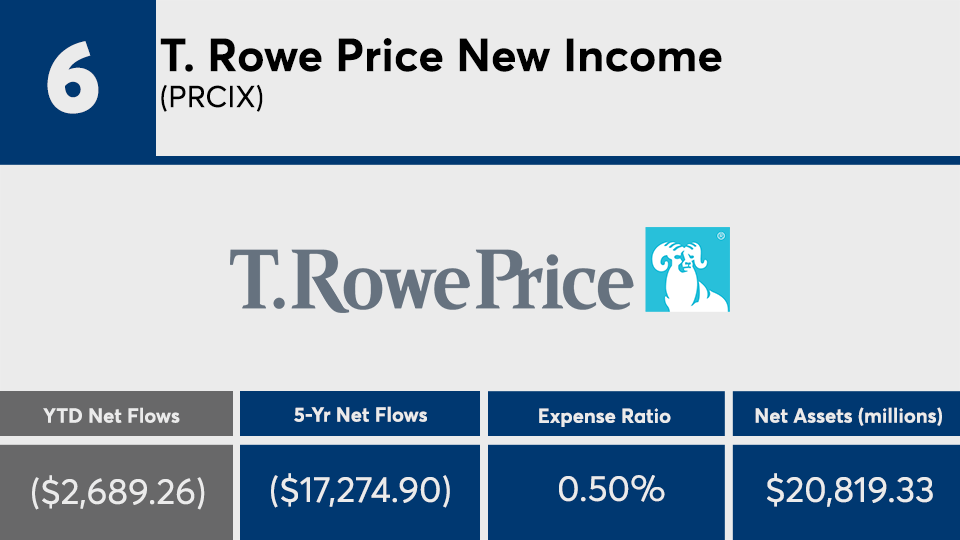
T. Rowe Price New Income (PRCIX)

YTD Return: -3.01%
1-Yr. Return: 3.00%
3-Yr. Annualized Return: 2.62%
5-Yr. Annualized Return: 2.03%
10-Yr. Annualized Return: 3.26%
FP040820_5.png

iShares 20+ Year Treasury Bond ETF (TLT)

YTD Return: 23.85%
1-Yr. Return: 38.08%
3-Yr. Annualized Return: 14.16%
5-Yr. Annualized Return: 7.83%
10-Yr. Annualized Return: 9.80%
FP040820_4.png

Vanguard Total International Bond Index Admiral (VTABX)

YTD Return: 0.32%
1-Yr. Return: 5.26%
3-Yr. Annualized Return: 4.38%
5-Yr. Annualized Return: 3.38%
10-Yr. Annualized Return: N/A
FP040820_3.png

Fidelity Series Investment Grade Bond (FSIGX)

YTD Return: 0.49%
1-Yr. Return: 6.75%
3-Yr. Annualized Return: 4.18%
5-Yr. Annualized Return: 3.26%
10-Yr. Annualized Return: 4.06%
FP040820_2.png

Fidelity SAI US Treasury Bond Index (FUTBX)

YTD Return: 8.78%
1-Yr. Return: 14.10%
3-Yr. Annualized Return: 5.84%
5-Yr. Annualized Return: N/A
10-Yr. Annualized Return: N/A
FP040820_1.png

Vanguard Total Bond Market II Index Investor (VTBIX)

YTD Return: 3.14%
1-Yr. Return: 9.27%
3-Yr. Annualized Return: 4.62%
5-Yr. Annualized Return: 3.18%
10-Yr. Annualized Return: 3.80%
MORE FROM FINANCIAL PLANNING