Worst bond fund returns of the decade

Bond duration is key when measuring long-term success in the fixed-income world.

Broad analysis of the worst-performing bond funds of the decade shows all of the funds at the bottom of the pack managed to eke out a gain, however minimal, according to Morningstar Direct. However, with an average return of less than 1%, the funds undershot the Bloomberg Barclays US Aggregate Bond Index’s 3.78% return over the same period, as measured by the iShares Core US Aggregate Bond ETF (AGG). Unlike their top-performing peers, these funds are some of the lowest-duration products on the market, notes Jeff Chang, co-founder and managing director at CBOE Vest.

“It was not until late 2016 when we saw yields rise slightly higher for a short period, and peak in the winter of 2018,” Chang says. “We then saw short-term rates retreat back down as the Fed backed off its overtightening policy, and then dropped the guillotine in March 2020. The result is essentially negative real return for much of the last decade, and perhaps in the future for many of these products.”

When compared to the top-performers’ 7.38% gain over the last decade, bond funds with the worst returns — most of which are actively managed — were significantly outpaced, data show. The industry’s biggest bond fund, the $269 billion Vanguard Total Bond Market Index Admiral (VBTLX), reported 10-year gains of 3.84% and YTD gain of 3.27%, data show. On the equities side, the largest overall fund, the $840.9 billion Vanguard Total Stock Market Index Fund Admiral Shares (VTSAX), which has a 0.04% expense ratio, posted a 10-year gain of 10.15% and YTD loss of 20.87%, data show.

Although fees among the worst-performers are slightly lower than the rest of the fund industry, they are pricier than their top-performing bond fund peers. At an average of 41 basis points, the worst-performers carry fees well above the 0.30% of those at the top, however slightly below the 0.48% investors paid on average for fund investing last year, according to Morningstar’s most recent annual fee survey, which reviewed the asset-weighted average expense ratios of all U.S. open-end mutual funds and ETFs.

For advisors with clients worried about unprecedented market stress and their long-term savings, Chang says they may consider new ways of implementing risk management, and structure their portfolios to take advantage of buying opportunities.

“Tactical risk management does not have to mean jumping out of the frying pan and into the fire,” he says. “The low-duration negative yield sector of the market just happens to be a smoldering, slow-burning fire with current yield levels.”

Scroll through to see the 20 fixed-income funds ranked by their lowest 10-year returns through March 26. Funds with less than $500 million in assets under management and investment minimums over $100,000 were excluded, as were leveraged and institutional funds. Assets and expense ratios are listed for each, as well as year-to-date, one-, three- and five-year returns. The data show each fund's primary share class. All data from Morningstar Direct.
FP040120_20.png

DFA Two-Year Global Fixed-Income I (DFGFX)

1-Yr. Return: 2.15%
3-Yr. Annualized Return: 1.87%
5-Yr. Annualized Return: 1.39%
FP040120_19.png

DFA CA Short-Term Municipal Bond I (DFCMX)

1-Yr. Return: 0.97%
3-Yr. Annualized Return: 1.03%
5-Yr. Annualized Return: 0.90%
FP040120_18.png

American Funds ST Bond Fund of America A (ASBAX)

1-Yr. Return: 3.02%
3-Yr. Annualized Return: 1.87%
5-Yr. Annualized Return: 1.42%
Load: 2.50%
FP040120_17.png

iShares International Treasury Bond ETF (IGOV)

1-Yr. Return: 0.12%
3-Yr. Annualized Return: 2.49%
5-Yr. Annualized Return: 1.49%
FP040120_16.png

Virtus Seix US Government Securities Ultra-Short Bond I (SIGVX)

1-Yr. Return: 1.29%
3-Yr. Annualized Return: 1.51%
5-Yr. Annualized Return: 1.08%
FP040120_15.png

Vanguard Short-Term Tax-Exempt Admiral (VWSUX)

1-Yr. Return: 1.55%
3-Yr. Annualized Return: 1.49%
5-Yr. Annualized Return: 1.17%
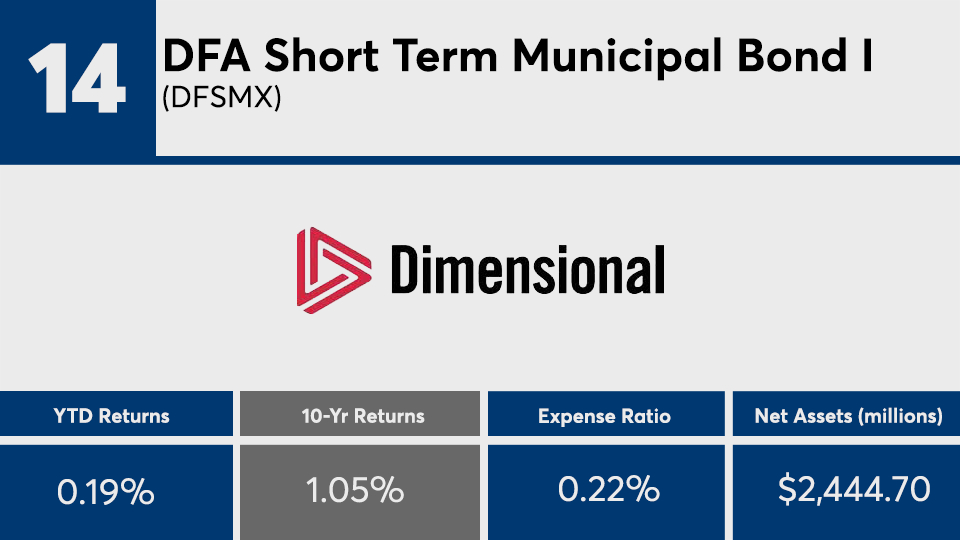
FP040120_14.png

DFA Short Term Municipal Bond I (DFSMX)

1-Yr. Return: 1.29%
3-Yr. Annualized Return: 1.11%
5-Yr. Annualized Return: 0.99%
FP040120_13.png

Putnam Short Duration Bond A (PARTX)

1-Yr. Return: -2.62%
3-Yr. Annualized Return: 0.99%
5-Yr. Annualized Return: 1.17%
Load: 2.25%
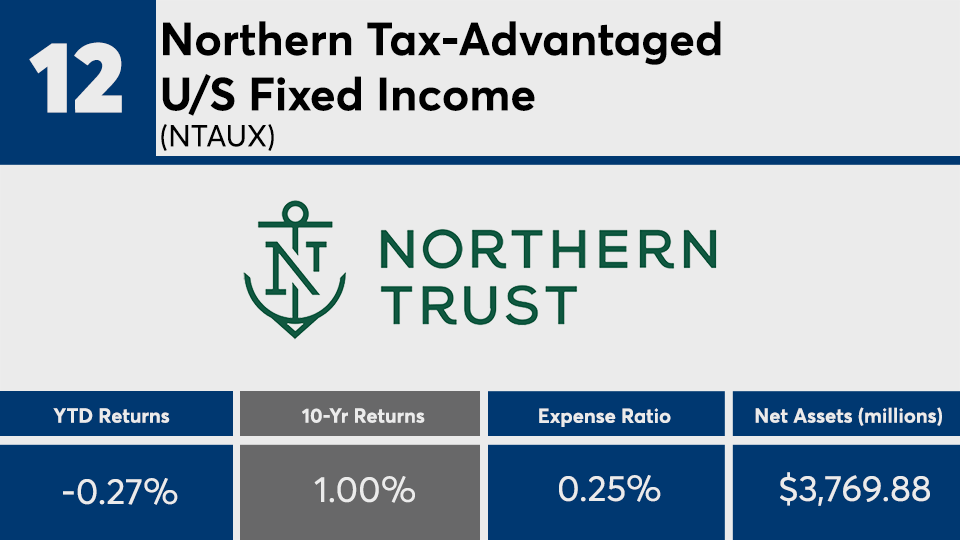
FP040120_12.png

Northern Tax-Advantaged U/S Fixed Income (NTAUX)

1-Yr. Return: 1.41%
3-Yr. Annualized Return: 1.35%
5-Yr. Annualized Return: 1.09%
FP040120_11.png

BNY Mellon Natl Short Term Muni Bond Ms Bd (MPSTX)

1-Yr. Return: 1.12%
3-Yr. Annualized Return: 1.21%
5-Yr. Annualized Return: 0.91%
FP040120_10.png

T. Rowe Price Ltd Dur Inflation Focus (TRBFX)

1-Yr. Return: 1.45%
3-Yr. Annualized Return: 1.26%
5-Yr. Annualized Return: 1.18%
FP040120_9.png

DFA One-Year Fixed-Income I (DFIHX)

1-Yr. Return: 1.98%
3-Yr. Annualized Return: 1.75%
5-Yr. Annualized Return: 1.27%
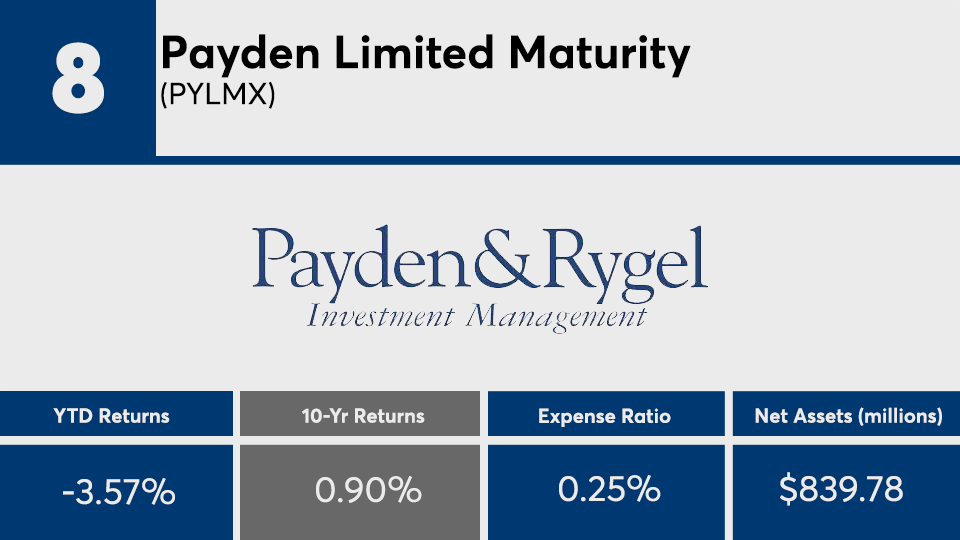
FP040120_8.png

Payden Limited Maturity (PYLMX)

1-Yr. Return: -1.39%
3-Yr. Annualized Return: 0.90%
5-Yr. Annualized Return: 0.86%
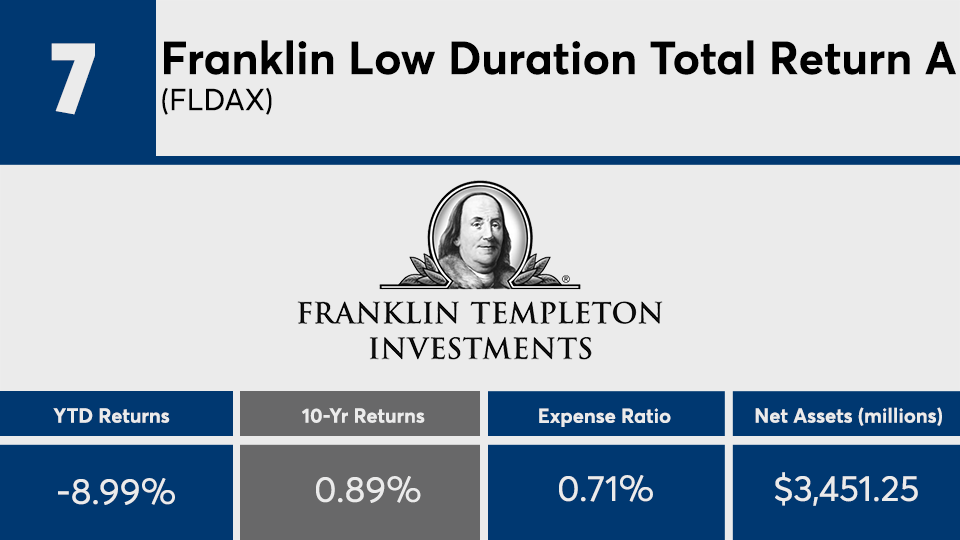
FP040120_7.png

Franklin Low Duration Total Return A (FLDAX)

1-Yr. Return: -6.87%
3-Yr. Annualized Return: -1.27%
5-Yr. Annualized Return: -0.33%
Load: 2.25%
FP040120_6.png

SEI Short Duration Municipal F STET (SUMAX)

1-Yr. Return: 0.90%
3-Yr. Annualized Return: 1.05%
5-Yr. Annualized Return: 0.68%
FP040120_5.png

iShares Short Treasury Bond ETF (SHV)

1-Yr. Return: 2.63%
3-Yr. Annualized Return: 1.85%
5-Yr. Annualized Return: 1.20%
FP040120_4.png

Trust for Credit Unions U-S Duration TCU (TCUUX)

1-Yr. Return: 1.10%
3-Yr. Annualized Return: 1.18%
5-Yr. Annualized Return: 0.77%
FP040120_3.png

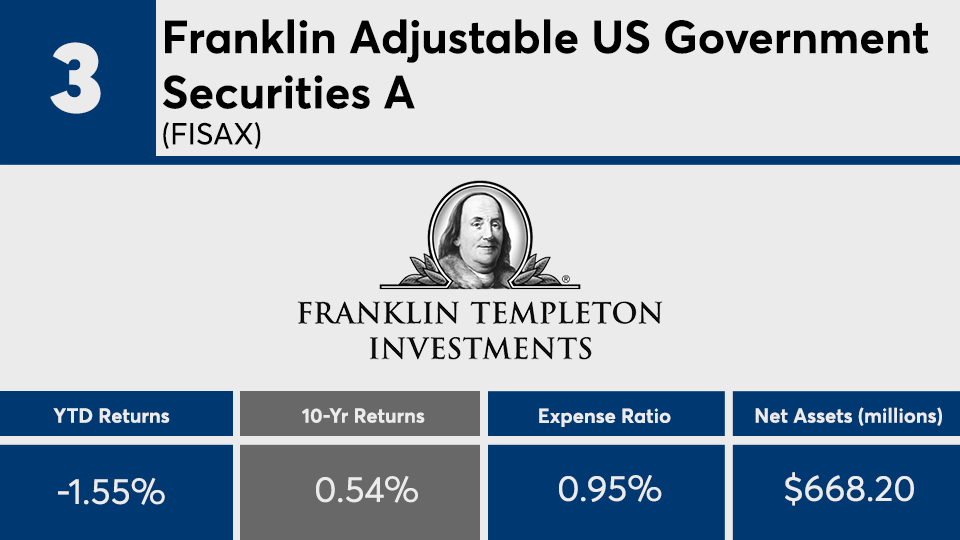
Franklin Adjustable US Government Securities A (FISAX)

1-Yr. Return: -0.05%
3-Yr. Annualized Return: 0.34%
5-Yr. Annualized Return: 0.11%
Load: 2.25%
FP040120_2.png

SPDR Blmbg Barclays 1-3 Month Treasury-Bill ETF (BIL)

1-Yr. Return: 1.97%
3-Yr. Annualized Return: 1.60%
5-Yr. Annualized Return: 0.98%
FP040120_1.png

American Century International Bond Investor (BEGBX)

1-Yr. Return: -3.76%
3-Yr. Annualized Return: 0.42%
5-Yr. Annualized Return: 0.26%
MORE FROM FINANCIAL PLANNING