Worst-performing bond funds of 2020

Many of the 20 bond funds with biggest losses of 2020 were off to a great start — that is until COVID-19 reshaped financial markets.

With an average loss of more than 4%, fixed-income funds that ended the year with the worst returns fell well below their peers, Morningstar Direct data show. With a minimum AUM threshold of $100 million, the funds here were home to a combined $44.7 billion.

“Long-term Treasurys won in 2020 due to their significant gains during the first quarter. However, they now face the prospect of higher yields during an economic recovery, and potential losses along with that,” says Toews Asset Management CEO Phil Toews. “Investment-grade bonds are also vulnerable to rising yields, even before the Fed begins to be less accommodative.”

Pitted against broader markets, the iShares Core U.S. Aggregate Bond ETF (AGG) recorded a 7.42% return in 2020, data show. In stocks, index trackers such as the SPDR S&P 500 ETF Trust (SPY) and the SPDR Dow Jones Industrial Average ETF Trust (DIA) had returns of 18.4% and 9.62%, respectively, over the same period, data show.

Bond funds with the biggest losses had an average expense ratio of more than twice the rest of the fund industry. With an average fee of nearly 100 basis points, these products were well above the 0.45% investors paid for fund investing in 2019, according to Morningstar’s most recent annual fee survey.

For advisors, Toews says the lesson from the bottom is to consider the bigger picture.

“Just-on-time-methods of communicating with investors about underperformance don’t work,” Toews says. “Instead, our behavioral investing institute teaches advisors to proactively train investors to understand and execute counter-intuitive decisions. When an asset class trails, it may be more likely to move higher.”

Scroll through to see the 20 bond funds with the biggest losses of 2020. Funds with less than $100 million in AUM were excluded, as were funds with investment minimums above $100,000, leveraged and institutional funds. Assets and expense ratios, as well as three-, five- and 10-year returns through Jan. 11 are also listed for each. Minimum initial investments and loads are also listed when applicable. The data show each fund's primary share class. All data is from Morningstar Direct.

FP011121_20 copy.png

Invesco BulletShares 2022 High Yield Corporate Bond ETF (BSJM)

5-Yr. Annualized Return: 5.59%
10-Yr. Annualized Return: N/A
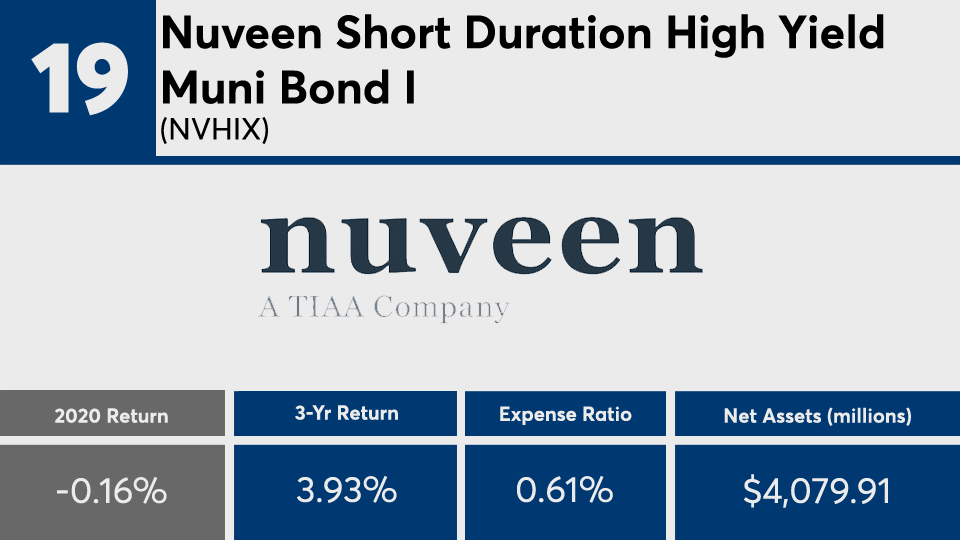
FP011121_19 copy.png

Nuveen Short Duration High Yield Muni Bond I (NVHIX)

5-Yr. Annualized Return: 3.93%
10-Yr. Annualized Return: N/A
Minimum Initial Investment: $100,000
FP011121_18 copy.png

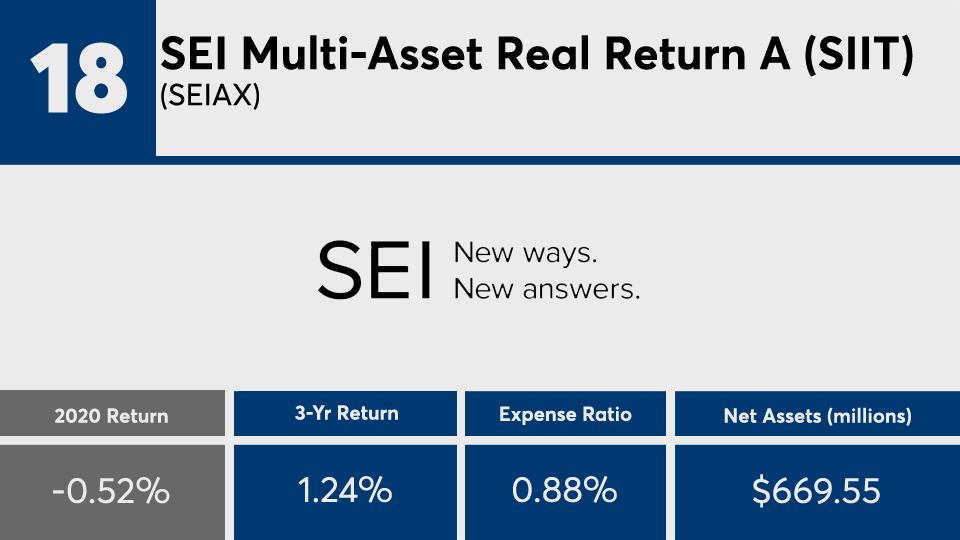
SEI Multi-Asset Real Return A (SIIT) (SEIAX)

5-Yr. Annualized Return: 1.45%
10-Yr. Annualized Return: N/A
Minimum Initial Investment: $100,000
FP011121_19 copy.png

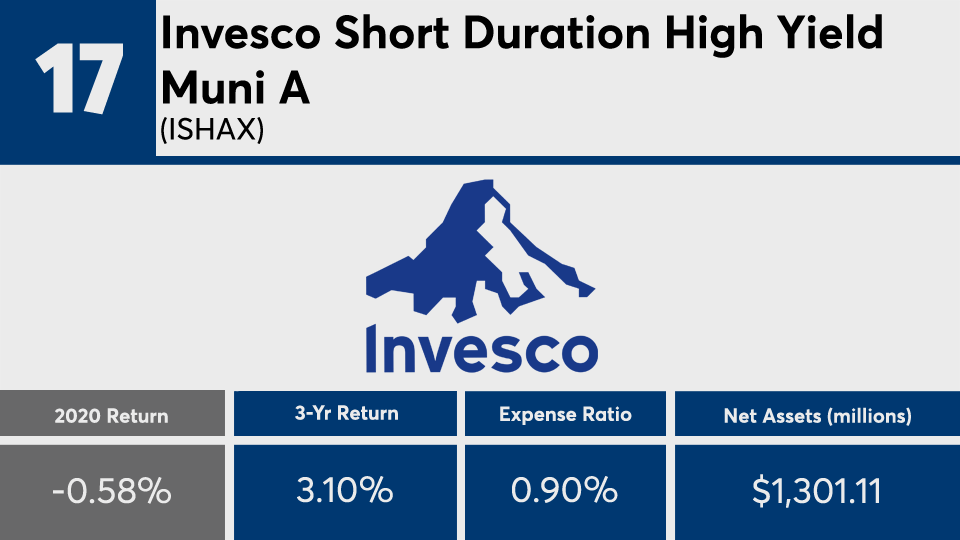
Invesco Short Duration High Yield Muni A (ISHAX)

5-Yr. Annualized Return: 3.8%
10-Yr. Annualized Return: N/A
Minimum Initial Investment: $1,000
Front Load: 2.5%
FP011121_16 copy.png

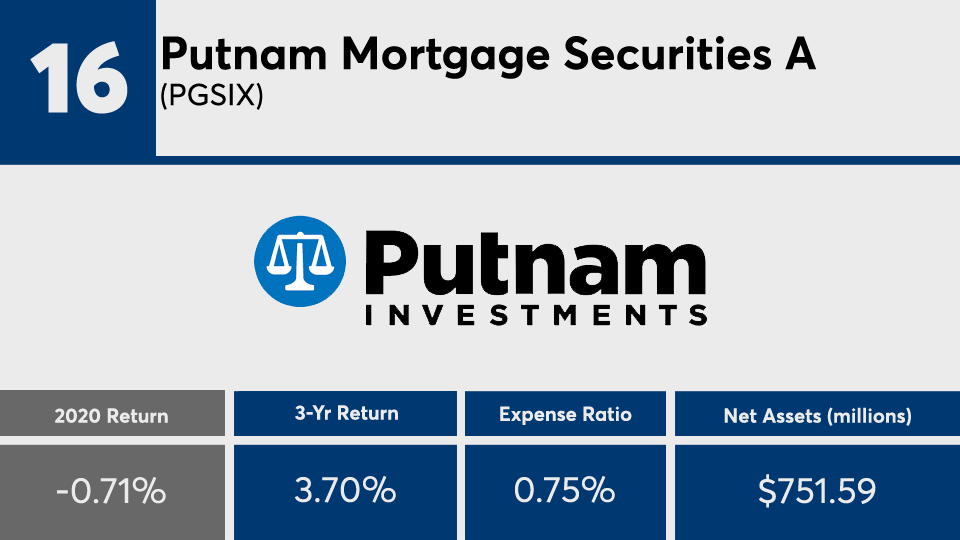
Putnam Mortgage Securities A (PGSIX)

5-Yr. Annualized Return: 2.53%
10-Yr. Annualized Return: 2.49%
Front Load: 4%
FP011121_15 copy.png

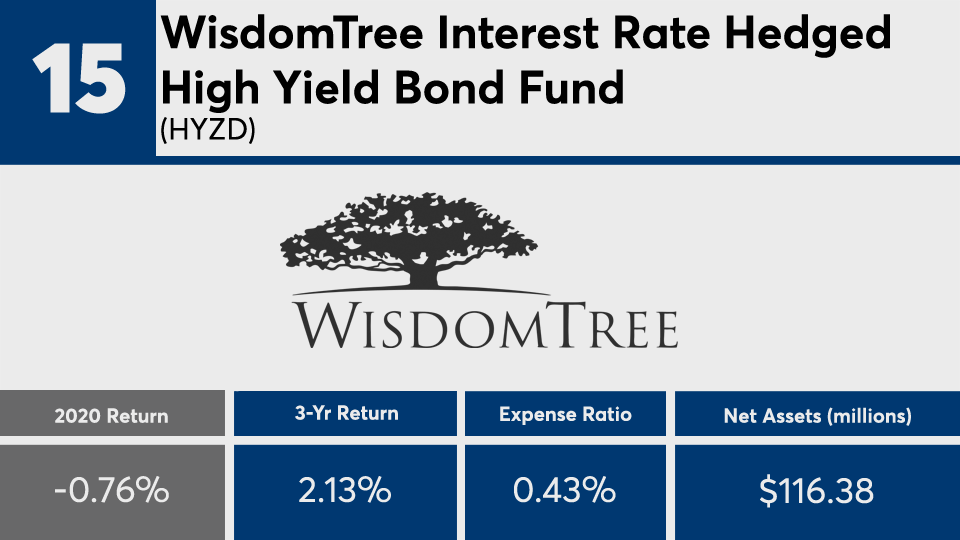
WisdomTree Interest Rate Hedged High Yield Bond Fund (HYZD)

5-Yr. Annualized Return: 5.59%
10-Yr. Annualized Return: N/A
FP011121_14 copy.png

Lord Abbett Floating Rate F (LFRFX)

5-Yr. Annualized Return: 3.99%
10-Yr. Annualized Return: 3.82%
FP011121_13 copy.png

Thompson Bond (THOPX)

5-Yr. Annualized Return: 4.14%
10-Yr. Annualized Return: 3.32%
Minimum Initial Investment: $250
FP011121_12 copy.png

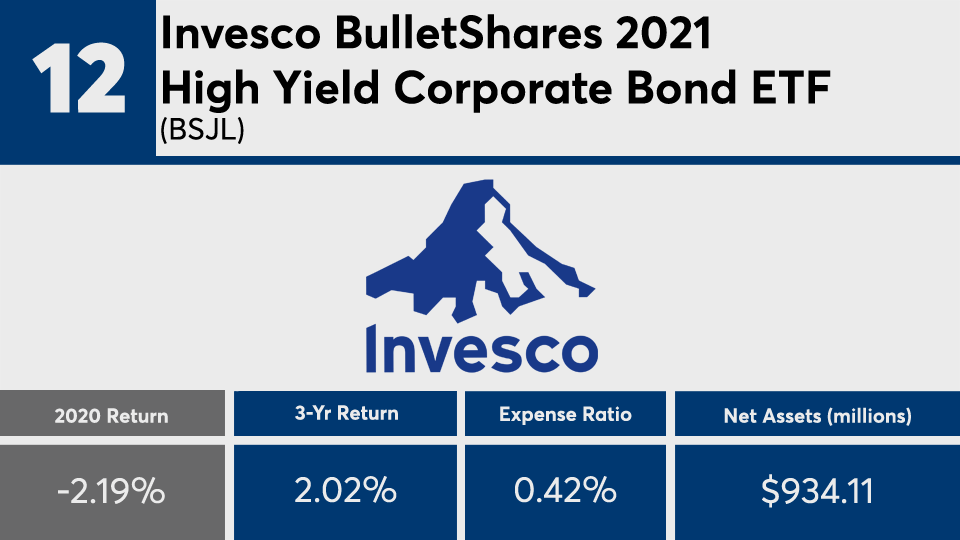
Invesco BulletShares 2021 High Yield Corporate Bond ETF (BSJL)

5-Yr. Annualized Return: 5.3%
10-Yr. Annualized Return: N/A
FP011121_11 copy.png

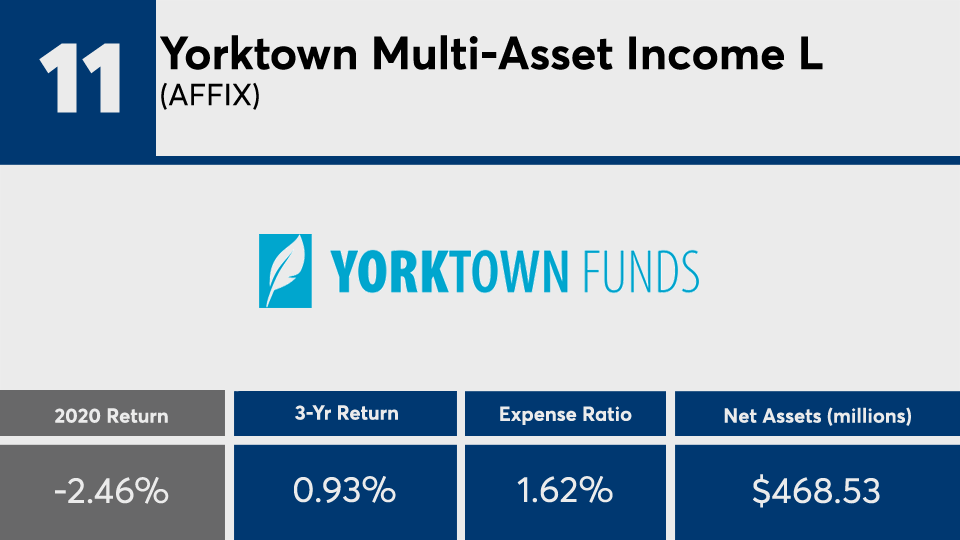
Yorktown Multi-Asset Income L (AFFIX)

5-Yr. Annualized Return: 5.89%
10-Yr. Annualized Return: 3.8%
Minimum Initial Investment: $1,000
FP011121_10 copy.png

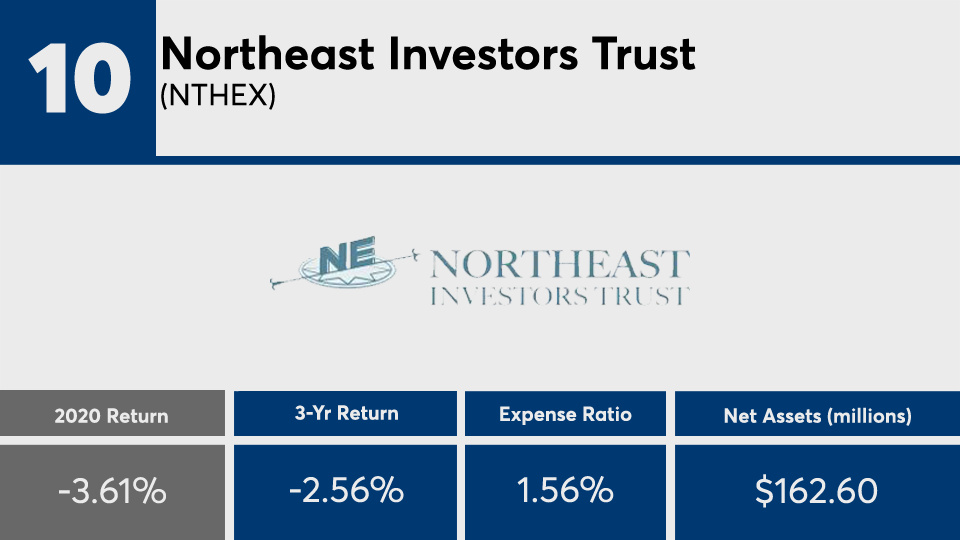
Northeast Investors Trust (NTHEX)

5-Yr. Annualized Return: 3.26%
10-Yr. Annualized Return: 1.35%
Minimum Initial Investment: $1,000
FP011121_9 copy.png

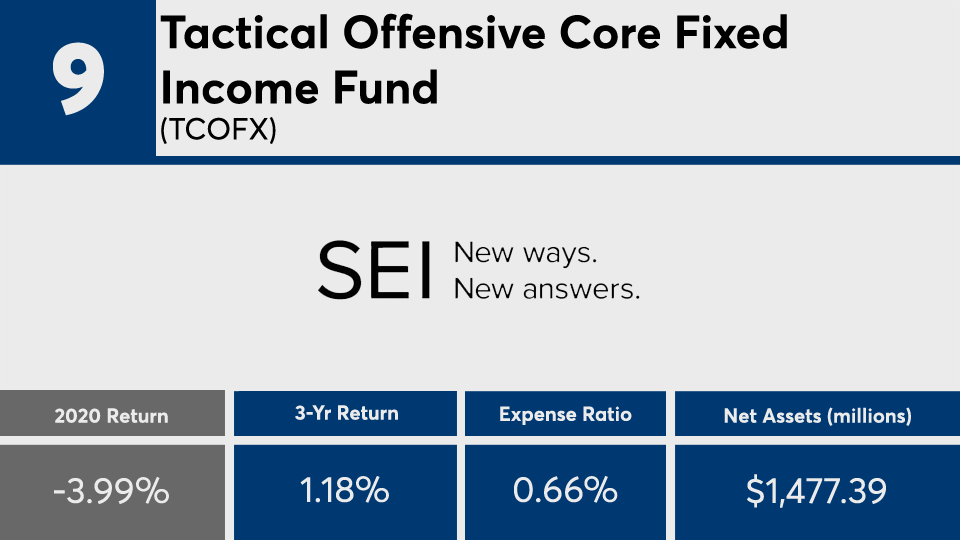
Tactical Offensive Core Fixed Income Fund (TCOFX)

5-Yr. Annualized Return: 2.22%
10-Yr. Annualized Return: N/A
FP011121_8 copy.png

Franklin Floating Rate Daily Access A (FAFRX)

5-Yr. Annualized Return: 2.66%
10-Yr. Annualized Return: 2.45%
Minimum Initial Investment: $1,000
Front Load: 2.25%
FP011121_7 copy.png

Templeton Global Bond Advisor (TGBAX)

5-Yr. Annualized Return: 1.89%
10-Yr. Annualized Return: 1.97%
Minimum Initial Investment: $100,000
FP011121_6 copy.png

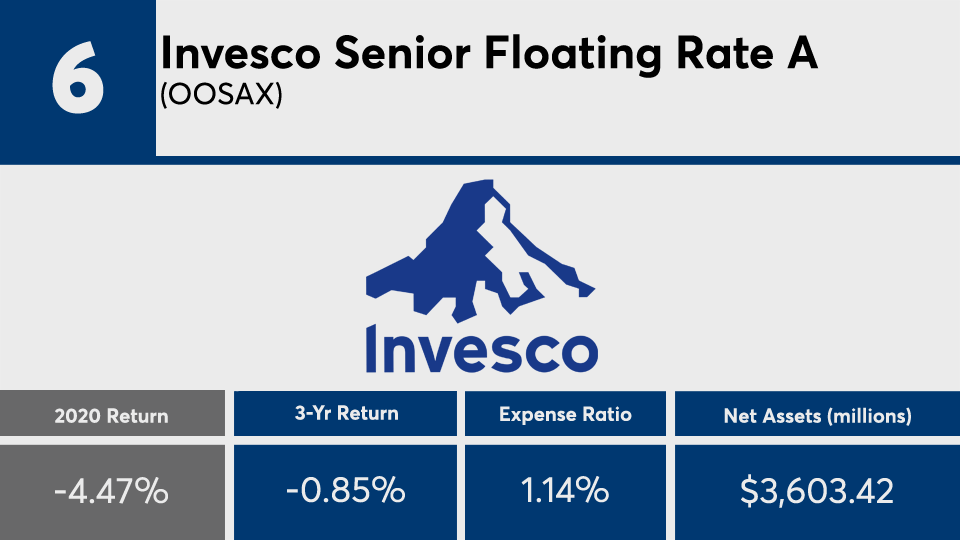
Invesco Senior Floating Rate A (OOSAX)

5-Yr. Annualized Return: 2.76%
10-Yr. Annualized Return: 2.82%
Minimum Initial Investment: $1,000
Front Load: 3.25%
FP011121_5 copy.png

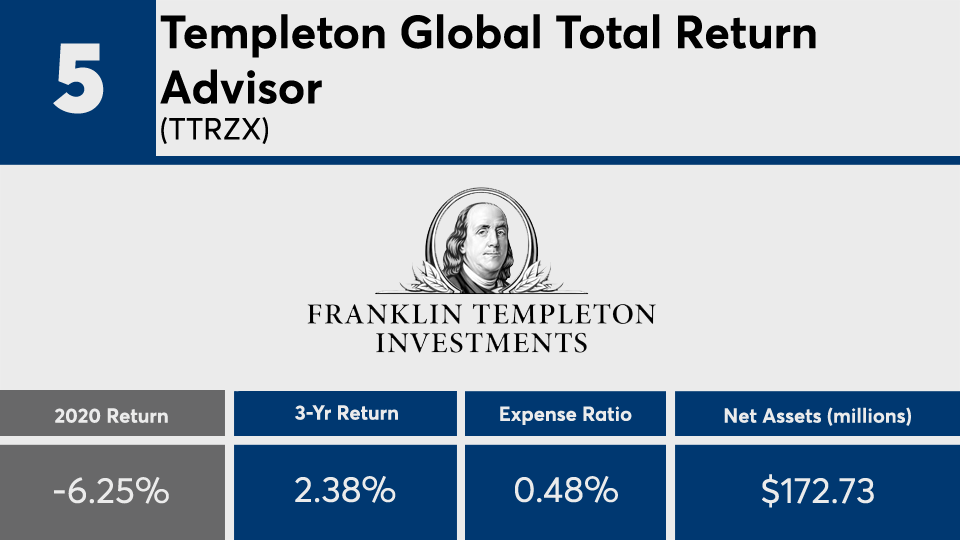
Templeton Global Total Return Advisor (TTRZX)

5-Yr. Annualized Return: 2.36%
10-Yr. Annualized Return: 2.54%
Minimum Initial Investment:
FP011121_4 copy.png

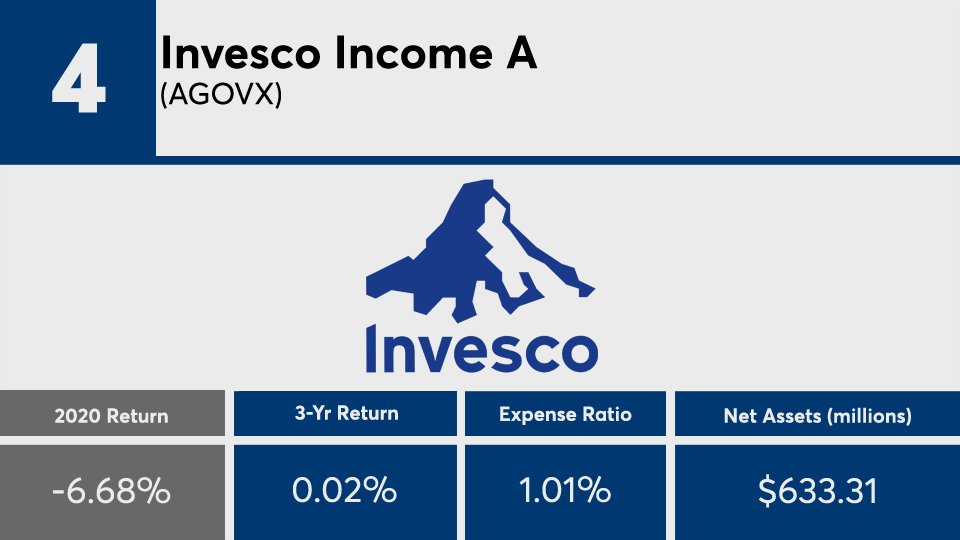
Invesco Income A (AGOVX)

5-Yr. Annualized Return: 0.47%
10-Yr. Annualized Return: 1.33%
Minimum Initial Investment: $1,000
Front Load: 4.25%
FP011121_3 copy.png

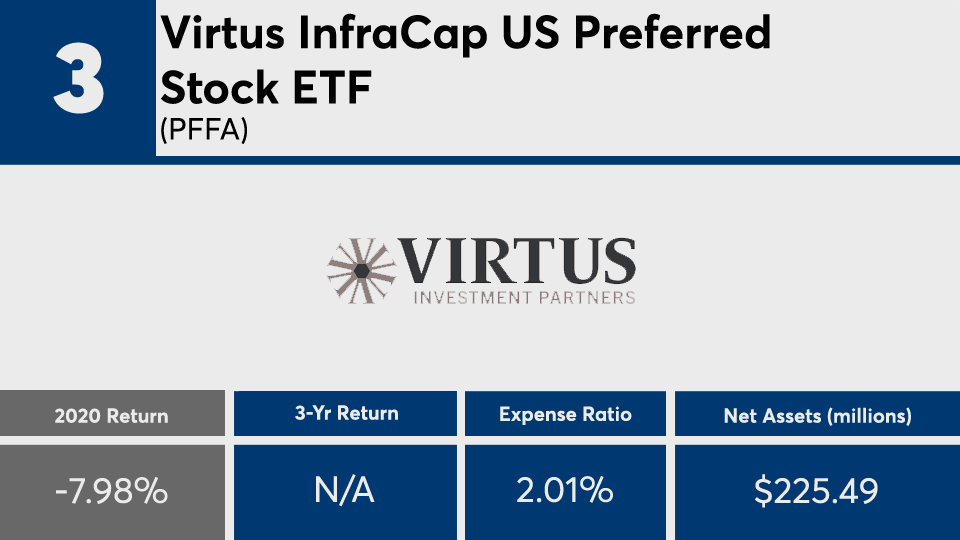
Virtus InfraCap US Preferred Stock ETF (PFFA)

5-Yr. Annualized Return: N/A
10-Yr. Annualized Return: N/A
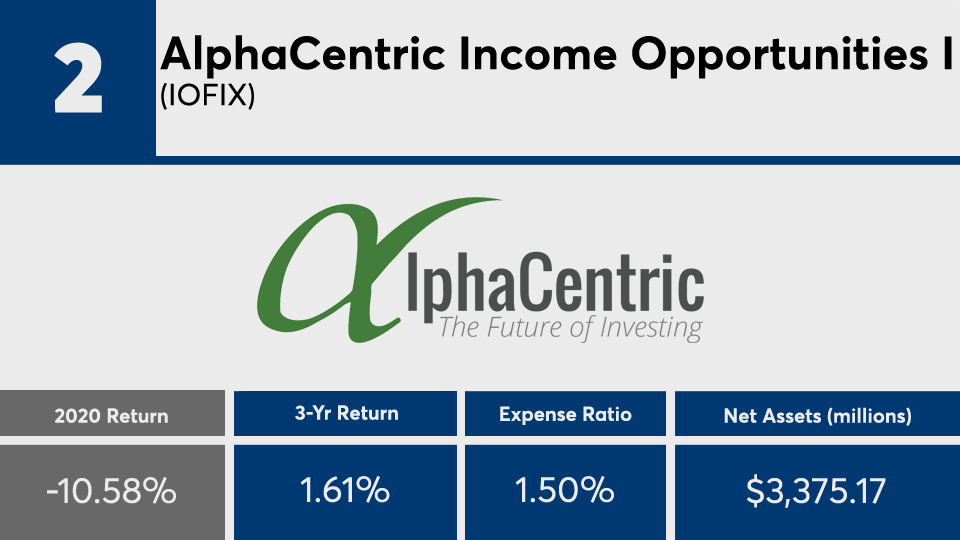
FP011121_2 copy.png

AlphaCentric Income Opportunities I (IOFIX)

5-Yr. Annualized Return: 1.61%
10-Yr. Annualized Return: 5.61%
Minimum Initial Investment: $2,500
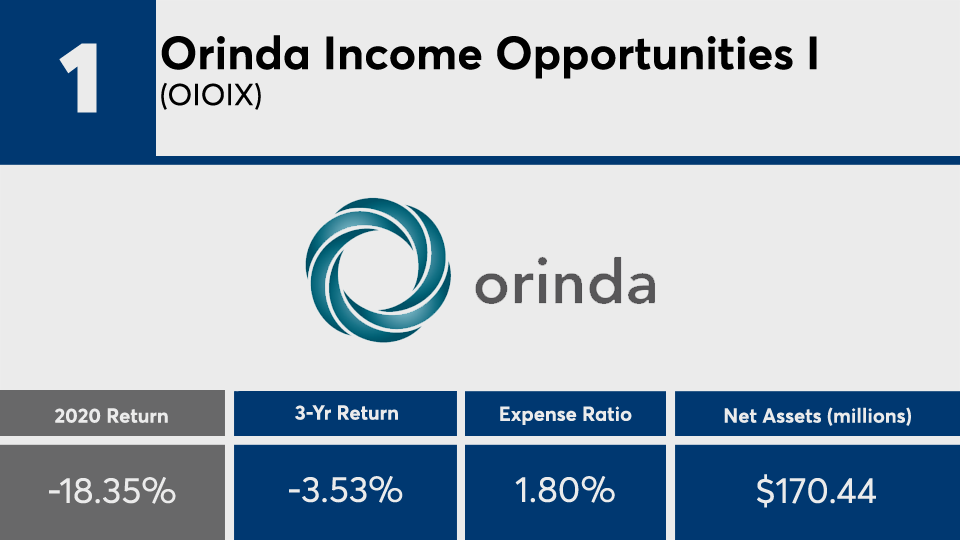
FP011121_1 copy.png

Orinda Income Opportunities I (OIOIX)

5-Yr. Annualized Return: -3.53%
10-Yr. Annualized Return: 1.11%
Minimum Initial Investment: $100,000
MORE FROM FINANCIAL PLANNING