Bond funds with the worst 15-year returns

All of the fixed-income industry’s worst long-term performers recorded gains over all time horizons, with only one in the red so far in 2021.

The 20 worst-performing bond funds of the past 15 years, with at least $100 million in assets under management, notched an average gain of nearly 1.5%, Morningstar Direct data show. Over the past 12 months, the same funds — all actively managed like those in last week’s top-performers ranking — had an average return of 2.28%.

With Treasury yields hovering around 1% over the better part of the decade, Amy Magnotta, co-head of discretionary portfolios at Brinker Capital Investments, says it’s no surprise that the industry's shortest-duration bond funds had a large presence.

“All of the funds on the list with the worst 15-year returns are short-term bond funds, both taxable and municipal,” Magnotta says, adding, “The yield on the one-year Treasury bill has averaged just 1.16% over the last 15 years, and it spent most of the time period below 1%, which is not an attractive starting point for returns of shorter maturity securities.”

For comparison, the iShares Core U.S. Aggregate Bond ETF (AGG), which has a 0.04% net expense ratio, recorded a 15-year gain of 4.29%, data show. Over the past year, the fund had a gain of 0.60%. The iShares 2-3 Year Treasury Bond ETF (SHY), which tracks the ICE BofA 1-3 Year Treasury Index, had 1- and 15-year gains of 0.17% and 2.2%, respectively.

In stocks, the SPDR S&P 500 ETF Trust (SPY) and the SPDR Dow Jones Industrial Average ETF (DIA) have had 15-year returns of 10.30% and 10.32%, respectively. In the past 12 months, SPY and DIA had gains of 48.69% and 44.79%. The funds have net expense ratios of 0.09% and 0.16%.

Fees among bond funds in this ranking were higher than the industry average. With an overall net expense ratio of 0.58%, funds here were only slightly pricier than the 0.45% investors paid for fund investing in 2019, according to Morningstar’s most recent annual fee survey.

When discussing bond fund performance over any time horizon with clients, Magnotta says it’s key to also have a conversation about their role in a diversified portfolio.

“While bond funds can experience drawdowns when interest rates rise, as we saw in the first quarter of 2021, the drawdown is not at the level of magnitude associated with equity market drawdowns,” she says. “Short-duration fixed income strategies, like the funds on the list, can also serve as a diversifier within a client’s fixed income allocation and can be an attractive option in a rising interest rate environment.”

Scroll through to see the 20 bond funds with more than $100 million in AUM and the worst 15-year returns through April 15. Assets and average expense ratios, as well as year-to-date, one-, three-, five and 10-year returns are also listed for each, as are YTD-, one-, three-, five-, 10- and 15-year net share class flows through April 1. The data show each fund's primary share class. All data is from Morningstar Direct.
FP042021_20 copy.png
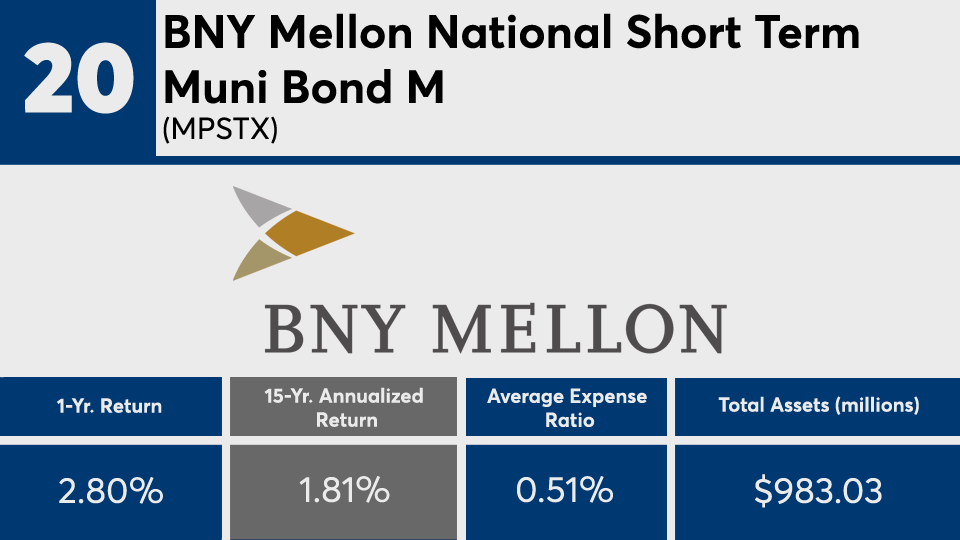
YTD Return: 0.31%; 3-Yr. Annualized Return: 2.1%; 5-Yr. Annualized Return: 1.43%; 10-Yr. Annualized Return: 1.16% YTD Net Flow: (millions): ($50.72); 1-Yr. Net Flow (millions): ($76.14); 3-Yr. Net Flow (millions): $37.35; 5-Yr. Net Flow (millions): ($55.09); 10-Yr. Net Flow (millions): ($43.21); 15-Yr. Net Flow (millions): $751.61; Minimum Initial Investment: $10,000; Inception Date: Oct. 2, 2000; Manager Name: John F. Flahive
FP042021_19 copy.png
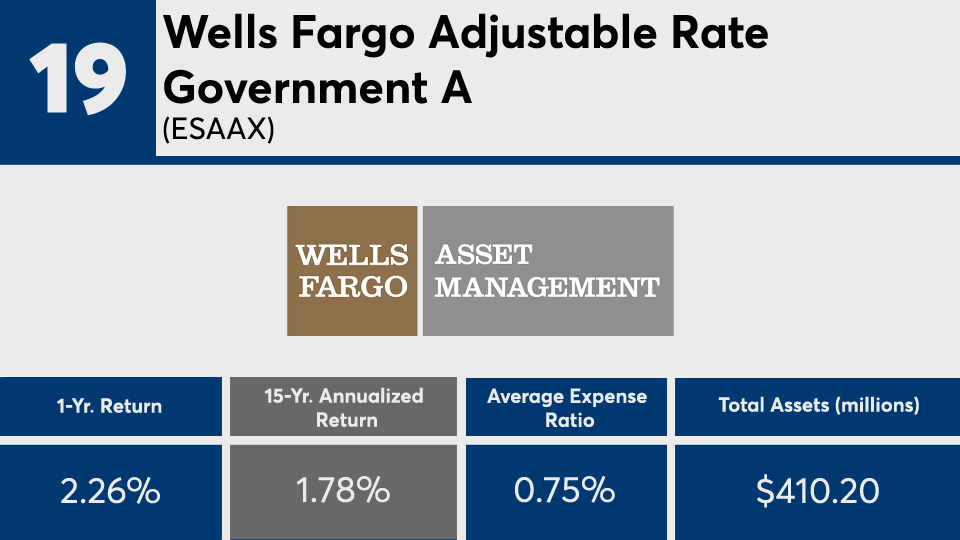
YTD Return: 0.4%; 3-Yr. Annualized Return: 1.79%; 5-Yr. Annualized Return: 1.26%; 10-Yr. Annualized Return: 1%; YTD Net Flow: (millions): ($2.83); 1-Yr. Net Flow (millions): ($2.53); 3-Yr. Net Flow (millions): ($25.32); 5-Yr. Net Flow (millions): ($79.54); 10-Yr. Net Flow (millions): ($190.47); 15-Yr. Net Flow (millions): ($512.69); Minimum Initial Investment: $1,000; Inception Date: June 30, 2000; Manager Names: Christopher Y. Kauffman and Michal Stanczyk
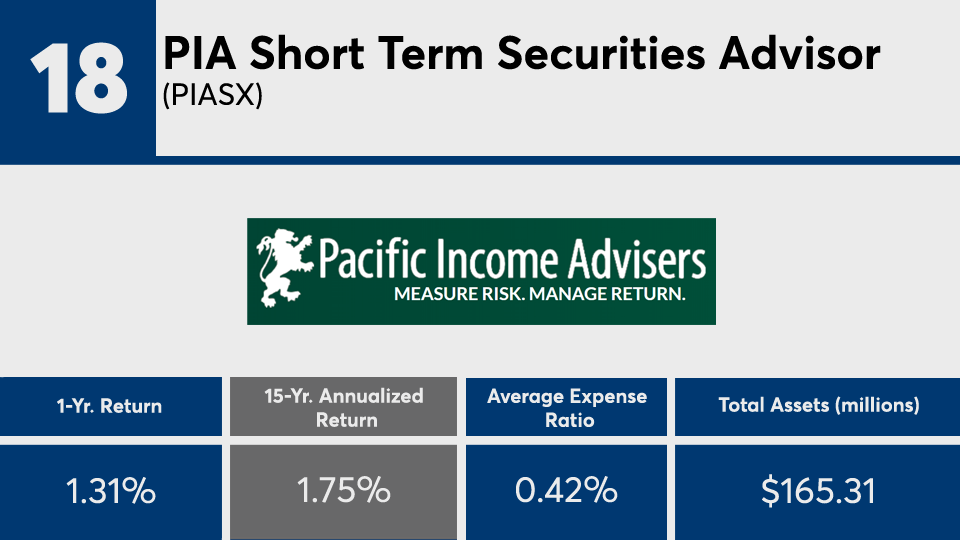
FP042021_18 copy.png
YTD Return: 0.11%; 3-Yr. Annualized Return: 2.1%; 5-Yr. Annualized Return: 1.61%; 10-Yr. Annualized Return: 1.04%; YTD Net Flow: (millions): ($31.54); 1-Yr. Net Flow (millions): $11.17; 3-Yr. Net Flow (millions): ($11.18); 5-Yr. Net Flow (millions): ($4.97); 10-Yr. Net Flow (millions): $7.73; 15-Yr. Net Flow (millions): $105.04; Minimum Initial Investment: $1,000; Inception Date: April 29, 1994; Manager Names: Lloyd McAdams, Rory Hargaden and Hsin Tong
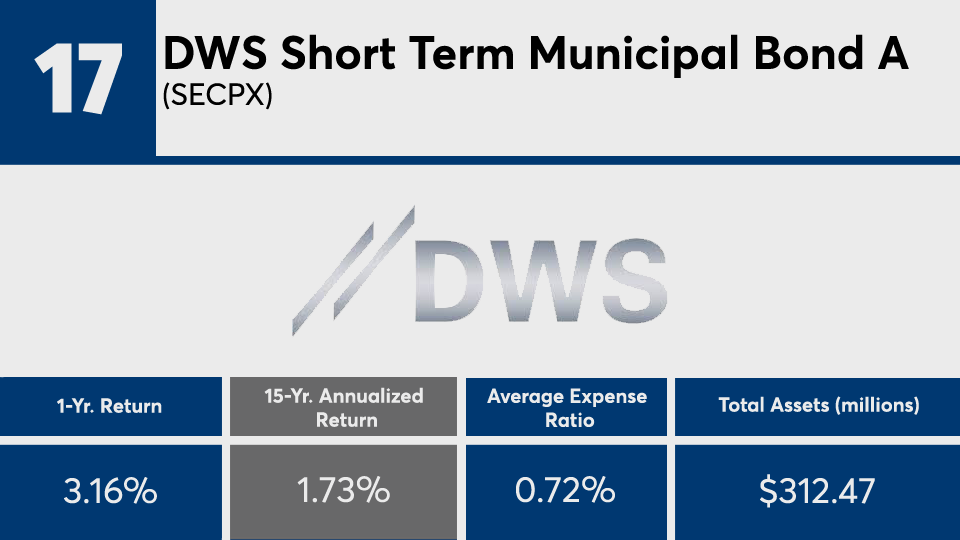
FP042021_17 copy.png
YTD Return: 0.19%; 3-Yr. Annualized Return: 2.39%; 5-Yr. Annualized Return: 1.48%; 10-Yr. Annualized Return: 1.35%; YTD Net Flow: (millions): $0.91; 1-Yr. Net Flow (millions): ($21.91); 3-Yr. Net Flow (millions): 29.72); 5-Yr. Net Flow (millions): ($37.89); 10-Yr. Net Flow (millions): ($240.73); 15-Yr. Net Flow (millions): ($1.99); Minimum Initial Investment: $1,000; Inception Date: Feb. 28, 2003; Manager Names: Ashton P. Goodfield, Matthew J. Caggiano and Peter Aloisi
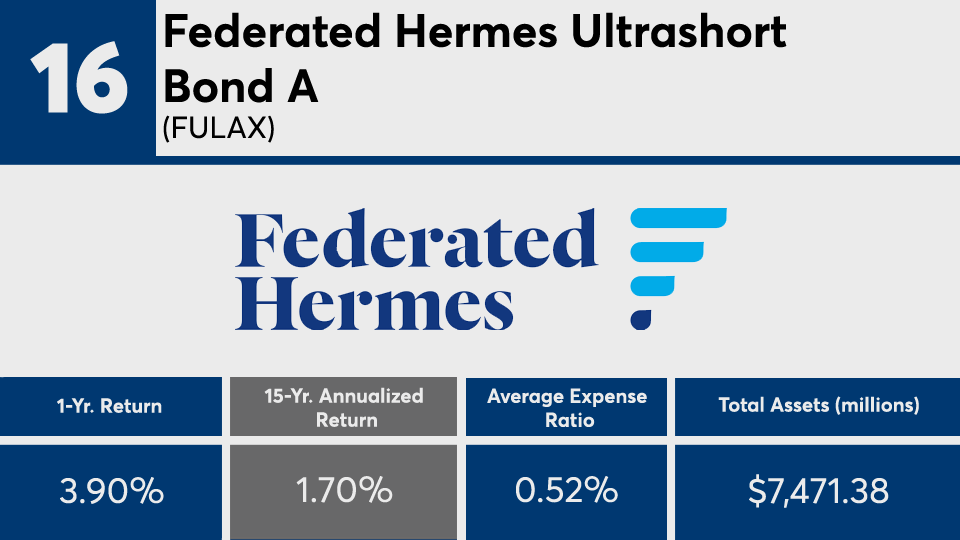
FP042021_16 copy.png
YTD Return: 0.32%; 3-Yr. Annualized Return: 2.23%; 5-Yr. Annualized Return: 1.78%; 10-Yr. Annualized Return: 1.19%; YTD Net Flow: (millions): $207.1; 1-Yr. Net Flow (millions): $758.15; 3-Yr. Net Flow (millions): $880.25; 5-Yr. Net Flow (millions): $855.31; 10-Yr. Net Flow (millions): $825.38; 15-Yr. Net Flow (millions): $1,050.93; Minimum Initial Investment: $1,500; Inception Date: Oct. 14, 2002; Manager Names: Randall S. Bauer and Nicholas S. Tripodes
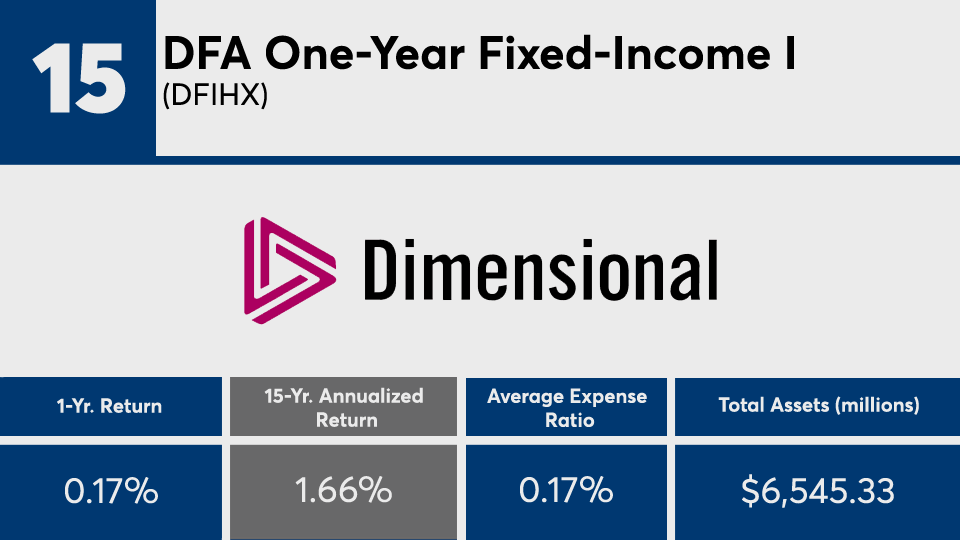
FP042021_15 copy.png
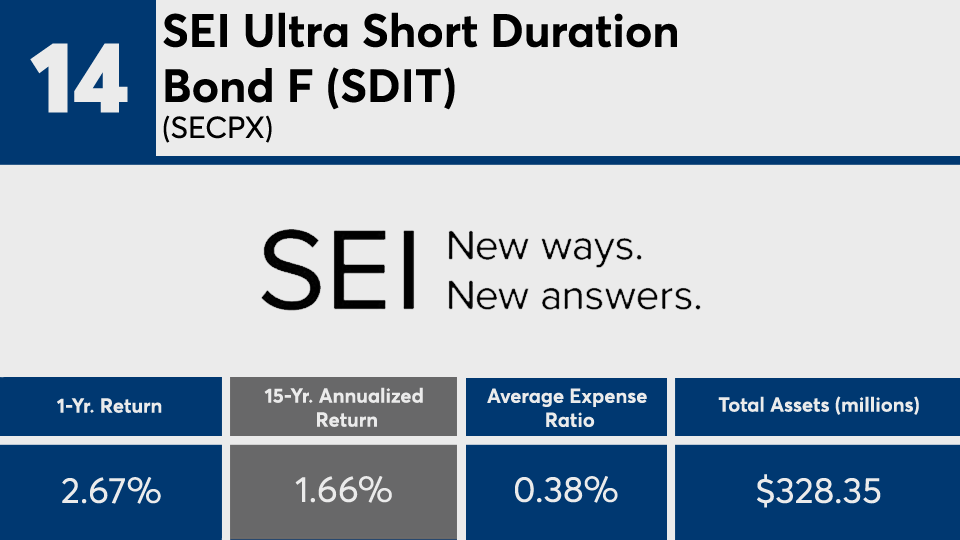
YTD Return: 0%; 3-Yr. Annualized Return: 1.57%; 5-Yr. Annualized Return: 1.23%; 10-Yr. Annualized Return: 0.88%; 15-Yr. Annualized Return: 1.6603%; YTD Net Flow: (millions): ($9.3); 1-Yr. Net Flow (millions): ($808.46); 3-Yr. Net Flow (millions): ($1,853.02); 5-Yr. Net Flow (millions): ($1,240.54); 10-Yr. Net Flow (millions): ($829.23); 15-Yr. Net Flow (millions): 3,132.61); Inception Date: July 25, 1983; Manager Names: David A. Plecha, Joseph F. Kolerich and Ryan C. Haselton
FP042021_14 copy.png
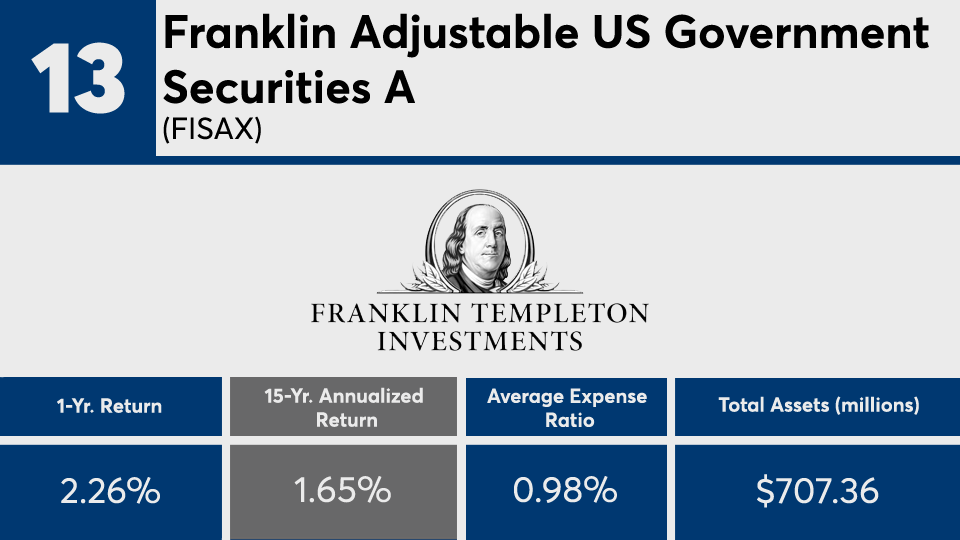
YTD Return: 0.1%; 3-Yr. Annualized Return: 2.2%; 5-Yr. Annualized Return: 1.89%; 10-Yr. Annualized Return: 1.39%; 15-Yr. Annualized Return: 1.6600%; YTD Net Flow: (millions): $0.4; 1-Yr. Net Flow (millions): $8.71; 3-Yr. Net Flow (millions): ($3.96); 5-Yr. Net Flow (millions): $43.33; 10-Yr. Net Flow (millions): $18.71; 15-Yr. Net Flow (millions): ($213.7); Inception Date: Sept. 28, 1993; Manager Names: Peter E. Mahoney, Timothy E. Smith, Scott D. Pavlak and Richard A. Bamford
FP042021_13 copy.png
YTD Return: 0.31%; 3-Yr. Annualized Return: 1.39%; 5-Yr. Annualized Return: 0.94%; 10-Yr. Annualized Return: 0.67%; 15-Yr. Annualized Return: 1.654%; YTD Net Flow: (millions): ($0.67); 1-Yr. Net Flow (millions): $14.88; 3-Yr. Net Flow (millions): ($16.35); 5-Yr. Net Flow (millions): ($349); 10-Yr. Net Flow (millions): ($1,038.90); 15-Yr. Net Flow (millions): ($111.1); Minimum Initial Investment: $1,000; Inception Date: Oct. 20, 1987; Manager Name: Paul Varunok
FP042021_12 copy.png
YTD Return: 0.13%; 3-Yr. Annualized Return: 2.38%; 5-Yr. Annualized Return: 1.84%; 10-Yr. Annualized Return: 1.24%; 15-Yr. Annualized Return: 1.649%; YTD Net Flow: (millions): $4.71; 1-Yr. Net Flow (millions): $67.94; 3-Yr. Net Flow (millions): $1.81; 5-Yr. Net Flow (millions): ($60.2); 10-Yr. Net Flow (millions): ($179.19); 15-Yr. Net Flow (millions): ($117.34); Minimum Initial Investment: $1,000; Inception Date: Aug. 31, 1999; Manager Names: Jay N. Mueller, Christopher Y. Kauffman, Michael J. Schueller and Noah M. Wise
FP042021_11 copy.png
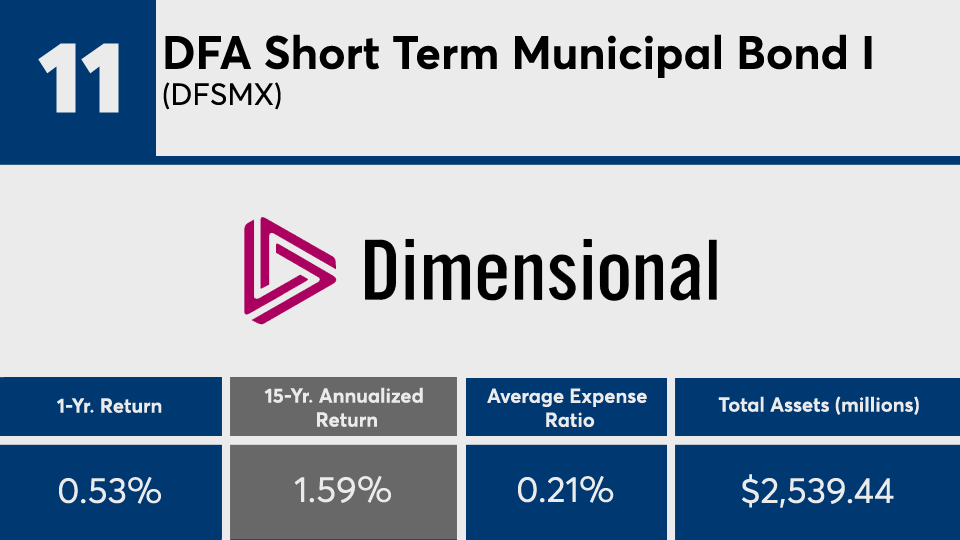
YTD Return: 0.1%; 3-Yr. Annualized Return: 1.22%; 5-Yr. Annualized Return: 0.82%; 10-Yr. Annualized Return: 0.95%; 15-Yr. Annualized Return: 1.594%; YTD Net Flow: (millions): $54.87; 1-Yr. Net Flow (millions): $61.71; 3-Yr. Net Flow (millions): ($191.59); 5-Yr. Net Flow (millions): $201.89; 10-Yr. Net Flow (millions): $793.63; 15-Yr. Net Flow (millions): $1,602.99; Inception Date: Aug. 20, 2002; Manager Names: David A. Plecha, Joseph F. Kolerich and Travis A. Meldau
FP042021_10 copy.png
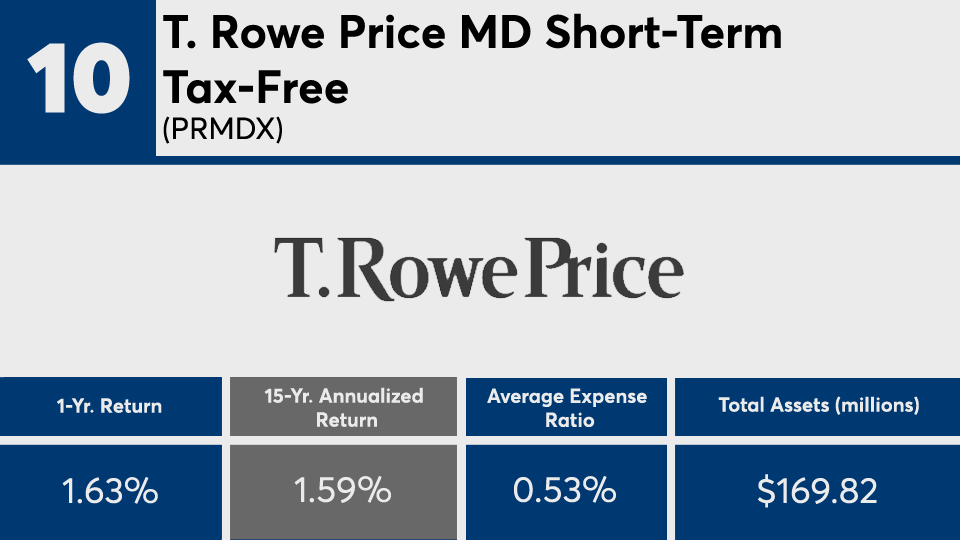
YTD Return: 0.25%; 3-Yr. Annualized Return: 1.66%; 5-Yr. Annualized Return: 0.99%; 10-Yr. Annualized Return: 0.92%; 15-Yr. Annualized Return: 1.593%; YTD Net Flow: (millions): $1.61; 1-Yr. Net Flow (millions): $2.86; 3-Yr. Net Flow (millions): ($45.06); 5-Yr. Net Flow (millions): ($92.47); 10-Yr. Net Flow (millions): ($137.29); 15-Yr. Net Flow (millions): ($75.69); Minimum Initial Investment: $2,500; Inception Date: Jan. 29, 1993; Manager Name: Charles B. Hill
FP042021_9 copy.png
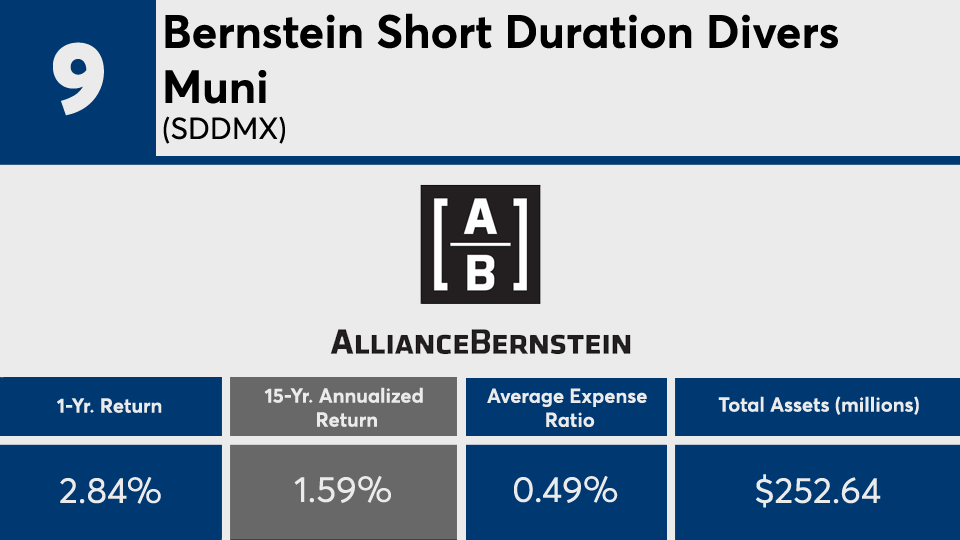
YTD Return: 0.34%; 3-Yr. Annualized Return: 1.98%; 5-Yr. Annualized Return: 1.28%; 10-Yr. Annualized Return: 1.01%; 15-Yr. Annualized Return: 1.590%; YTD Net Flow: (millions): $26.88; 1-Yr. Net Flow (millions): $43.67; 3-Yr. Net Flow (millions): $24.28; 5-Yr. Net Flow (millions): $71.31; 10-Yr. Net Flow (millions): ($307.11); 15-Yr. Net Flow (millions): ($41.29); Minimum Initial Investment: $25,000; Inception Date: Oct. 3, 1994; Manager Names: Terrance T. Hults, Matthew J Norton and Andrew D. Potter
FP042021_8 copy.png
YTD Return: 0.05%; 3-Yr. Annualized Return: 2.16%; 5-Yr. Annualized Return: 1.42%; 10-Yr. Annualized Return: 0.98%; 15. Annualized Return: 1.574%; YTD Net Flow: (millions): $33.14; 1-Yr. Net Flow (millions): $51.17; 3-Yr. Net Flow (millions): $52.08; 5-Yr. Net Flow (millions): ($75.55); 10-Yr. Net Flow (millions): ($386.05); 15-Yr. Net Flow (millions): ($149.97); Minimum Initial Investment: $25,000; Inception Date: Dec. 12, 1988; Manager Names: Shawn E. Keegan, Michael S. Canter and Janaki Rao
FP042021_7 copy.png
YTD Return: 0.21%; 3-Yr. Annualized Return: 1.72%; 5-Yr. Annualized Return: 1.14%; 10-Yr. Annualized Return: 0.88%; 15-Yr. Annualized Return: 1.565%; YTD Net Flow: (millions): ($12.06); 1-Yr. Net Flow (millions): ($59.83); 3-Yr. Net Flow (millions): ($196.22); 5-Yr. Net Flow (millions): ($378.42); 10-Yr. Net Flow (millions): $533.43; 15-Yr. Net Flow (millions): N/A; Minimum Initial Investment: $100,000; Inception Date: Nov. 13, 2003; Manager Names: S. Kenneth Leech, John C. Mooney, Robert E. Amodeo, Peter Moukios, Wendy Casetta, Kristian J. Lind, James Randazzo, Bruce R. Johns and Richard A. Bamford
FP042021_6 copy.png
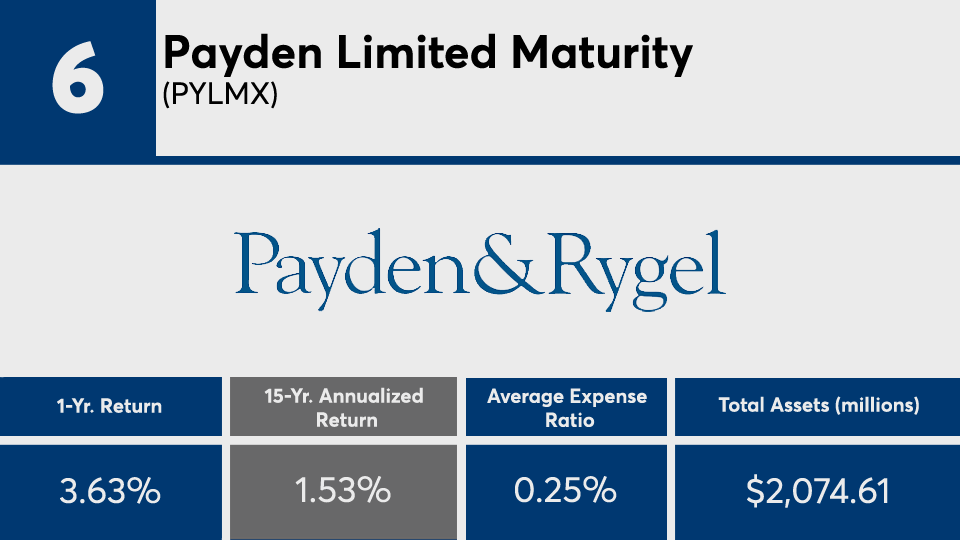
YTD Return: 0.2%; 3-Yr. Annualized Return: 2.23%; 5-Yr. Annualized Return: 1.93%; 10-Yr. Annualized Return: 1.32%; YTD Net Flow: (millions): $806.86; 1-Yr. Net Flow (millions): $1,160.46; 3-Yr. Net Flow (millions): $1,179.78; 5-Yr. Net Flow (millions): $1,552.13; 10-Yr. Net Flow (millions): $1,791.10; 15-Yr. Net Flow (millions): $1,739.50; Minimum Initial Investment: $5,000; Inception Date: April 29, 1994; Manager Names: Brian W. Matthews, Mary Beth Syal, David P. Ballantine, Larry Manis and Kerry Rapanot
FP042021_5 copy.png
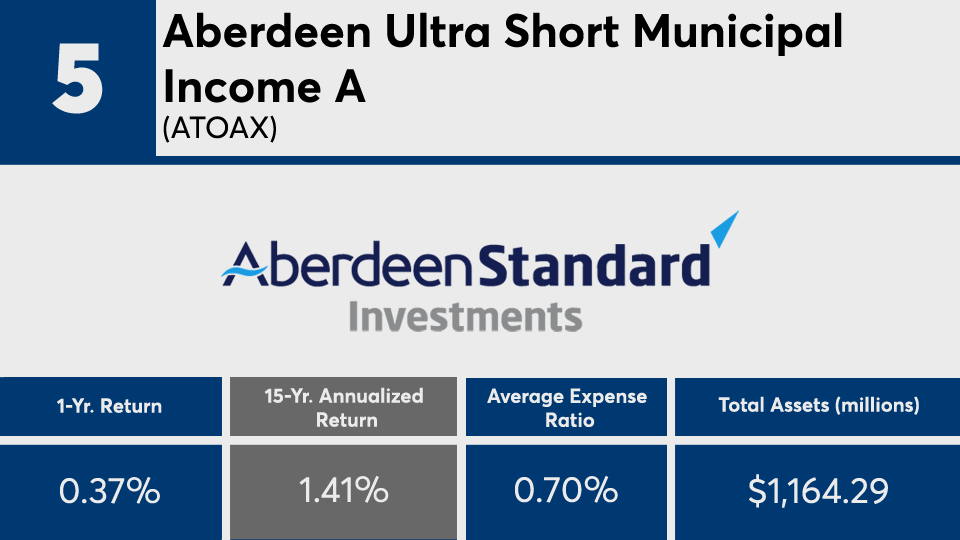
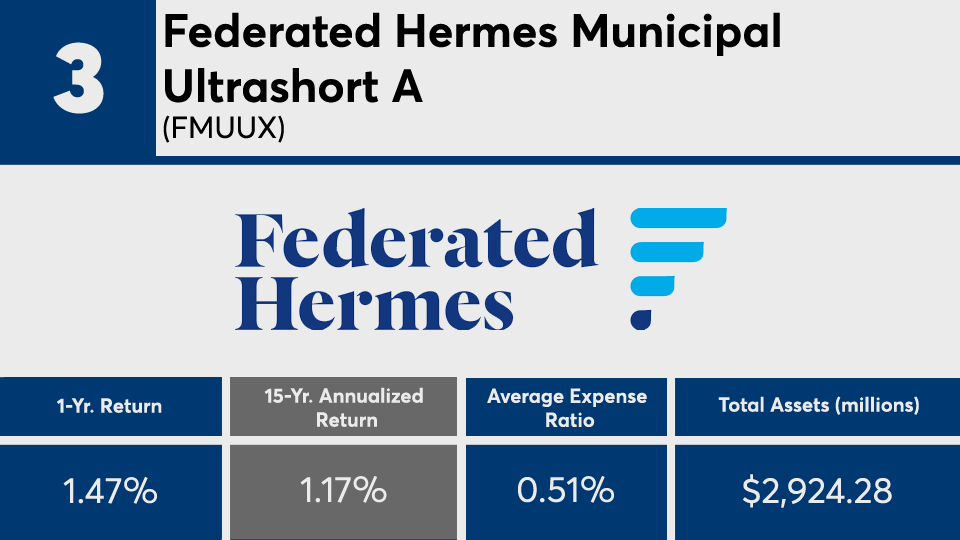
YTD Return: 0.01%; 3-Yr. Annualized Return: 0.95%; 5-Yr. Annualized Return: 0.81%; 10-Yr. Annualized Return: 0.67%; YTD Net Flow: (millions): ($35.22); 1-Yr. Net Flow (millions): $64.36; 3-Yr. Net Flow (millions): $30.22; 5-Yr. Net Flow (millions): $26.91; 10-Yr. Net Flow (millions): ($80.3); 15-Yr. Net Flow (millions): $206.31; Minimum Initial Investment: $1,000; Inception Date: March 30, 2004; Manager Names: Mark Taylor, Jonathan Mondillo and Miguel Laranjeiro
FP042021_4 copy.png
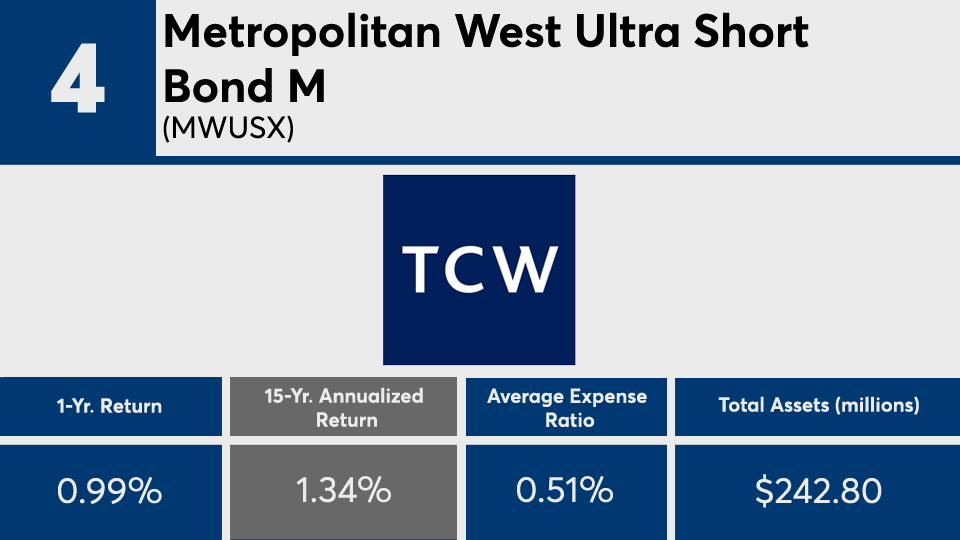
YTD Return: -0.11%; 3-Yr. Annualized Return: 1.81%; 5-Yr. Annualized Return: 1.41%; 10-Yr. Annualized Return: 1.35%; YTD Net Flow: (millions): ($9.3); 1-Yr. Net Flow (millions): $34.62; 3-Yr. Net Flow (millions): $10.95; 5-Yr. Net Flow (millions): ($16.82); 10-Yr. Net Flow (millions): $15.65; 15-Yr. Net Flow (millions): ($136.2); Minimum Initial Investment: $5,000; Inception Date: June 30, 2003; Manager Names: Tad Rivelle, Laird R. Landmann, Stephen M. Kane, Mitchell A. Flack and Bryan T. Whalen
FP042021_3 copy.png
YTD Return: 0.07%; 3-Yr. Annualized Return: 1.16%; 5-Yr. Annualized Return: 0.95%; 10-Yr. Annualized Return: 0.63%; YTD Net Flow: (millions): $34.45; 1-Yr. Net Flow (millions): $129.33; 3-Yr. Net Flow (millions): ($112.42); 5-Yr. Net Flow (millions): ($210.45); 10-Yr. Net Flow (millions): ($1,059.39); 15-Yr. Net Flow (millions): $438.92; Minimum Initial Investment: $1,500; Inception Date: Oct. 24, 2000; Manager Names: Mary Jo Ochson and Jeff A. Kozemchak
FP042021_2 copy.png
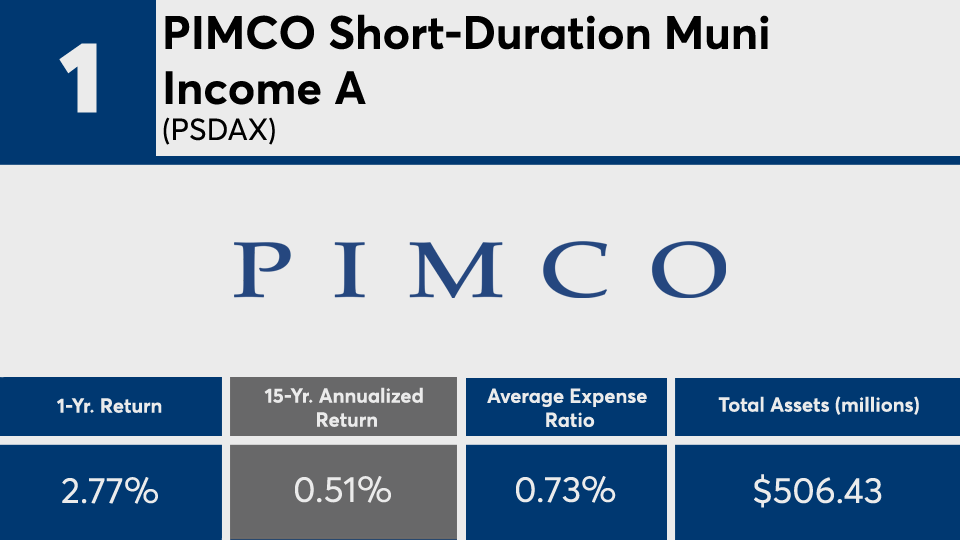
YTD Return: 0.33%; 3-Yr. Annualized Return: 2.01%; 5-Yr. Annualized Return: 2.59%; 10-Yr. Annualized Return: 1.02%; YTD Net Flow: (millions): $44.05; 1-Yr. Net Flow (millions): $70.64; 3-Yr. Net Flow (millions): $226.76; 5-Yr. Net Flow (millions): $338.17; 10-Yr. Net Flow (millions): $341.15; 15-Yr. Net Flow (millions): $332.2; Minimum Initial Investment: $1,000; Inception Date: July 1, 2004; Manager Names: David D. Basten, David M. Basten, Barry D. Weiss and John P. Tener
FP042021_1 copy.png
YTD Return: 0.19%; 3-Yr. Annualized Return: 2.34%; 5-Yr. Annualized Return: 1.5%; 10-Yr. Annualized Return: 1.05%; YTD Net Flow: (millions): ($27.85); 1-Yr. Net Flow (millions): $128.33; 3-Yr. Net Flow (millions): $151.08; 5-Yr. Net Flow (millions): $130.96; 10-Yr. Net Flow (millions): $105.26; 15-Yr. Net Flow (millions): $113.76; Minimum Initial Investment: $1,000; Inception Date: March 28, 2002; Manager Names: David Hammer and Rachel Betton
MORE FROM FINANCIAL PLANNING