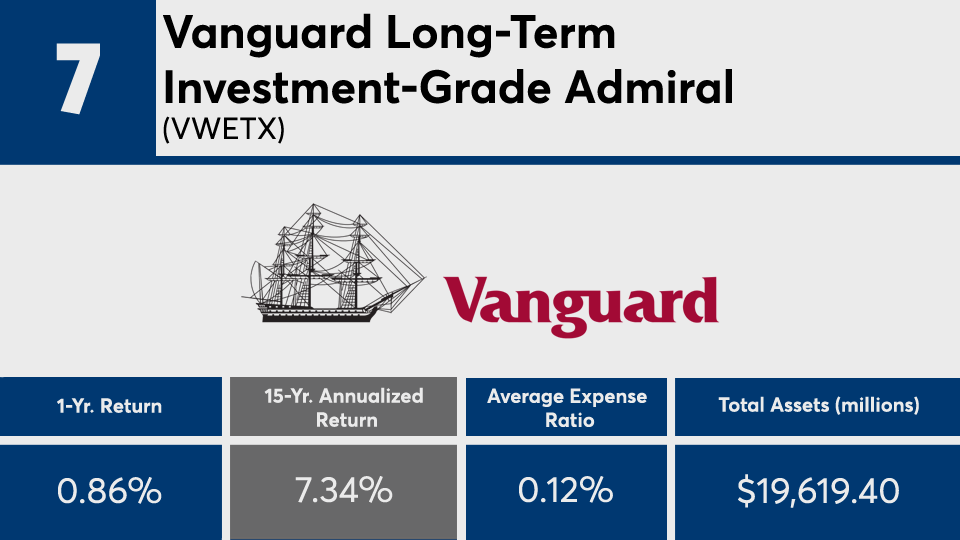
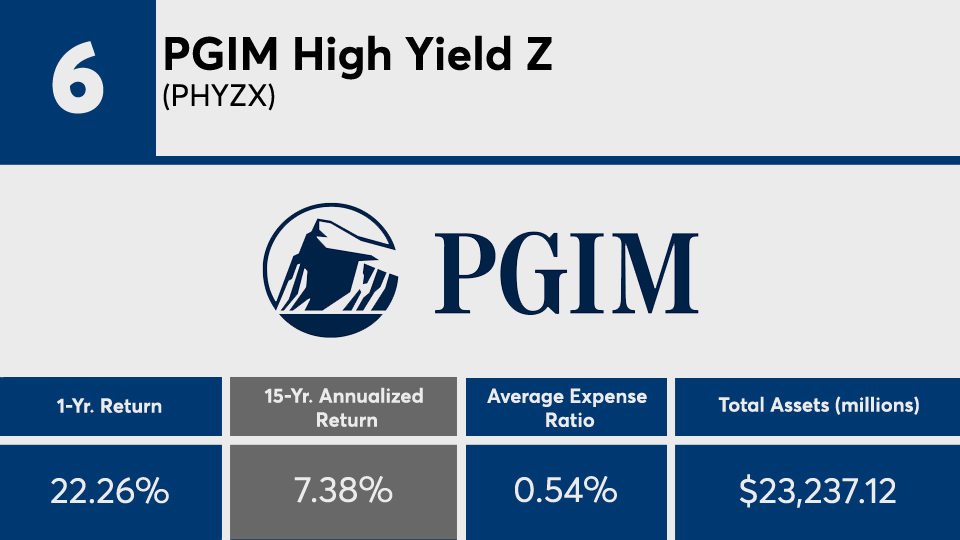
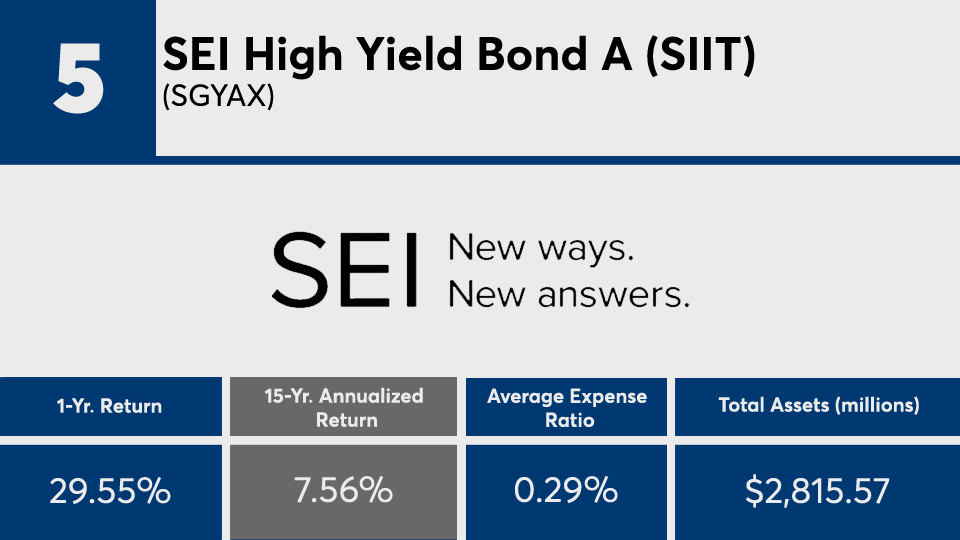
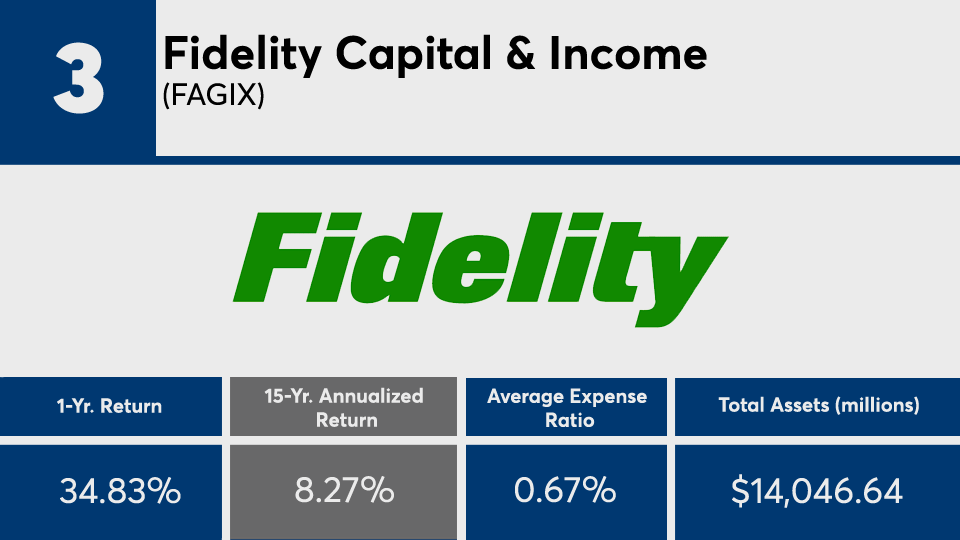
Bond funds with the best 15-year returns

Managers behind fixed-income funds with the biggest long-term gains nearly double their peers. After a year marked by a global pandemic and near-zero rate environment, their shorter term returns were subsequently even more impressive.

The 20 top-performing bond funds of the past 15 years, with at least $100 million in assets under management, had an average gain of more than 7%, Morningstar Direct data show. Over the past 12 months, the same funds notched an average return of almost 18%.

When considering the bond-market landscape over the shorter timer, it may be hard to fathom the same success in the years to come, says Tom Bradley, managing director and head of capital markets at Miami-based fixed-income software vendor YieldX.

“Last year was an aggressive year for fixed-income performance with global central banks slashing rates as a result of COVID-19, and at the same time re-engaging in secondary market bond purchasing — the perfect combination for high-yield performance,” Bradley says. “Now that markets have plateaued and interest rates globally look grounded (possibly trending higher in the U.S.), fixed income will become a more nuanced sector to invest in as opposed to the ‘rising tide lifts all ships’ mantra of the last few years.”

Compared with broader markets, the iShares Core U.S. Aggregate Bond ETF (AGG), which has a 0.04% net expense ratio, recorded a 15-year gain of just 4.23%, data show. Over the past year, the fund had a gain of 0.32%.

In stocks, the SPDR S&P 500 ETF Trust (SPY) and the SPDR Dow Jones Industrial Average ETF (DIA) have had 15-year returns of 10.20% and 10.28%, respectively. In the past 12 months, SPY and DIA had gains of 50.29% and 45.30%. The funds have net expense ratios of 0.09% and 0.16%.

Fees among the fixed-income leaders in this ranking, all of which are actively managed, were expectedly higher than the industry average. With an average net expense ratio of 0.65%, funds here were 20 basis points pricier than the 0.45% investors paid for fund investing in 2019, according to Morningstar’s most recent annual fee survey.

When discussing fixed-income holdings with clients, Steven Skancke, chief economic advisor at Huntsville, Alabama-based independent investment advisory firm Keel Point, says it’s important for advisors to discuss a product’s overall management objectives and current interest rate cycle.

“A principal goal in bond allocations is low volatility and drawdown in times of economic and equity market stress,” Skancke says, adding that “investors should pay attention to how bond funds perform in adverse financial markets.”

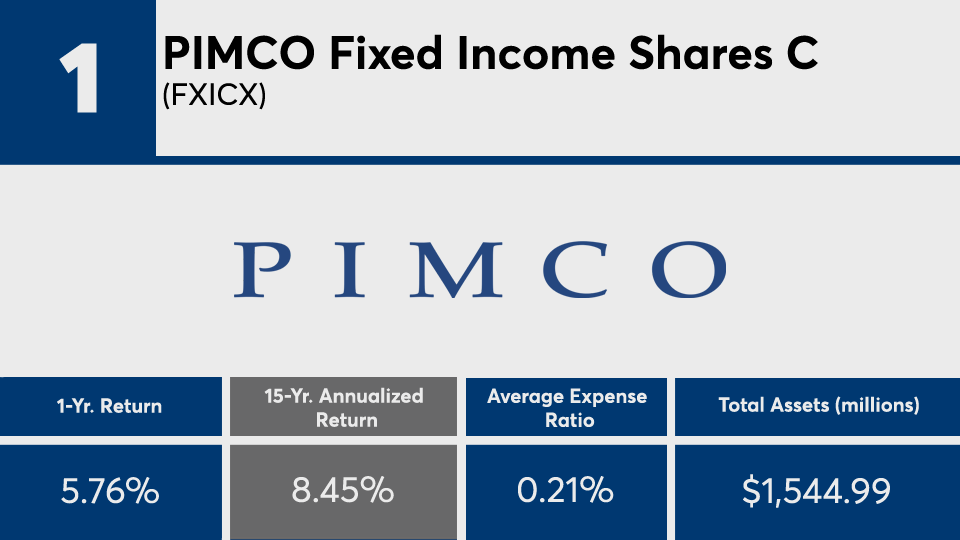
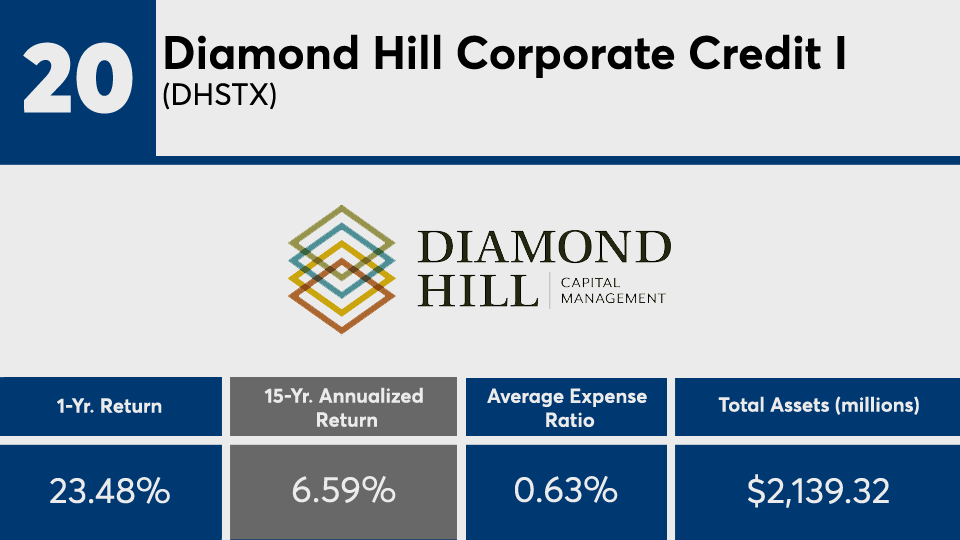
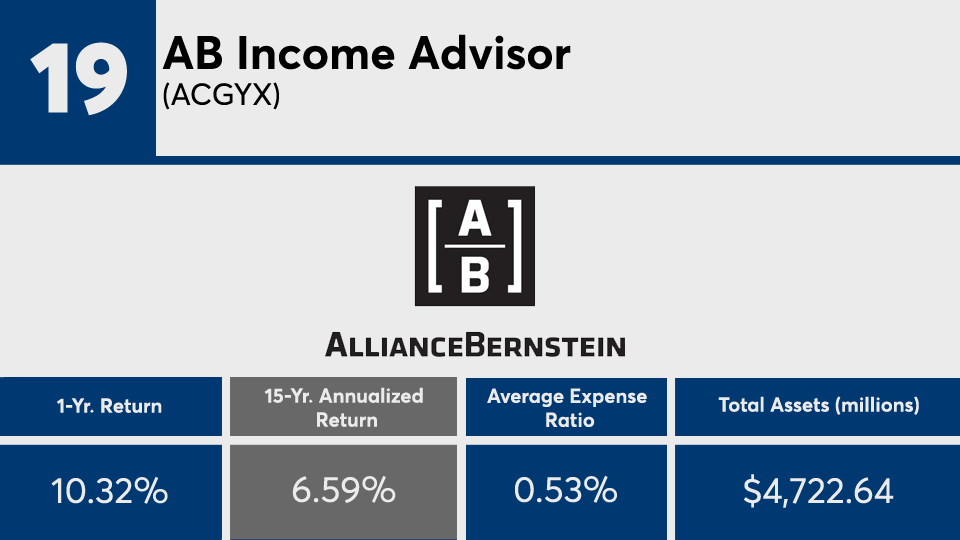
Scroll through to see the 20 bond funds with more than $100 million in AUM and the best 15-year returns through April 9. Assets and average expense ratios, as well as year-to-date, one-, three-, five and 10-year returns are also listed for each, as are YTD-, one-, three-, five-, 10- and 15-year net share class flows through April 1. The data show each fund's primary share class. All data is from Morningstar Direct.
FP041321_20 copy.png
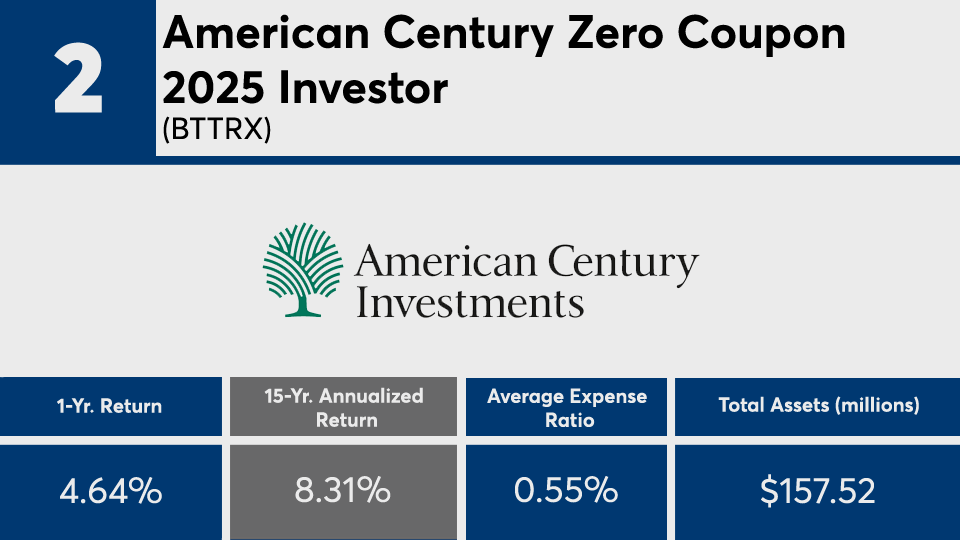
YTD Return: 1.42%; 3-Yr. Annualized Return: 8.02%; 5-Yr. Annualized Return: 8.26%; 10-Yr. Annualized Return: 6.57%; YTD Net Flow: (millions): $120.52; 1-Yr. Net Flow (millions): $847.83; 3-Yr. Net Flow (millions): $1,118.06; 5-Yr. Net Flow (millions): $1,339.79; 10-Yr. Net Flow (millions): $1,528.24; 15-Yr. Net Flow (millions): $1,567.78; Minimum Initial Investment: $2,500; Inception Date: Jan. 31, 2005; Manager Names: Bill Zox and John McClain
FP041321_19 copy.png
YTD Return: -2.14%; 3-Yr. Annualized Return: 5.09%; 5-Yr. Annualized Return: 4.55%; 10-Yr. Annualized Return: 5.22%; YTD Net Flow: (millions): $25.33; 1-Yr. Net Flow (millions): $144.06; 3-Yr. Net Flow (millions): $1,553.26; 5-Yr. Net Flow (millions): N/A; 10-Yr. Net Flow (millions): N/A; 15-Yr. Net Flow (millions): N/A; Inception Date: Aug. 28, 1987; Manager Names: Scott A. DiMaggio, Matthew S. Sheridan and Gershon M. Distenfeld
FP041321_18 copy.png
YTD Return: 1.02%; 3-Yr. Annualized Return: 5.07%; 5-Yr. Annualized Return: 6.96%; 10-Yr. Annualized Return: 5.47%; YTD Net Flow: (millions): ($1.02); 1-Yr. Net Flow (millions): ($6.23); 3-Yr. Net Flow (millions): ($49.61); 5-Yr. Net Flow (millions): ($36.75); 10-Yr. Net Flow (millions): ($118.99); 15-Yr. Net Flow (millions): ($86.04); Minimum Initial Investment: $2,500; Front Load: 4%; Redemption Load: 2%; Inception Date: Aug. 5, 1996; Manager Names: B. Scott Minerd, Kevin H. Gundersen, Thomas J. Hauser and Richard J de Wet
FP041321_17 copy.png
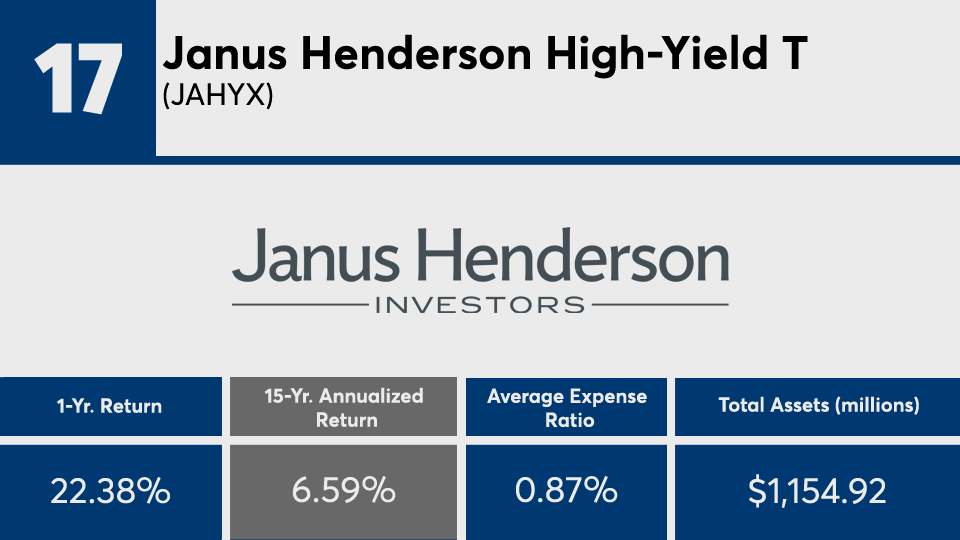
YTD Return: 2.13%; 3-Yr. Annualized Return: 6.59%; 5-Yr. Annualized Return: 7.02%; 10-Yr. Annualized Return: 5.71%; YTD Net Flow: (millions): $1.46; 1-Yr. Net Flow (millions): ($48.04); 3-Yr. Net Flow (millions): ($325.69); 5-Yr. Net Flow (millions): ($1,004.49); 10-Yr. Net Flow (millions): ($1,042.00); 15-Yr. Net Flow (millions): ($619.14); Minimum Initial Investment: $2,500; Inception Date: Dec. 29, 1995; Manager Names: Brent D. Olson and Seth Meyer
FP041321_16 copy.png
YTD Return: 1.16%; 3-Yr. Annualized Return: 6.27%; 5-Yr. Annualized Return: 6.97%; 10-Yr. Annualized Return: 5.69%; YTD Net Flow: (millions): ($9); 1-Yr. Net Flow (millions): ($34.81); 3-Yr. Net Flow (millions): ($170.38); 5-Yr. Net Flow (millions): ($314.25); 10-Yr. Net Flow (millions): ($599.77); 15-Yr. Net Flow (millions): ($841.72); Inception Date: May 3, 2004; Manager Names: Randall Parrish and Rick Cumberledge
FP041321_15 copy.png
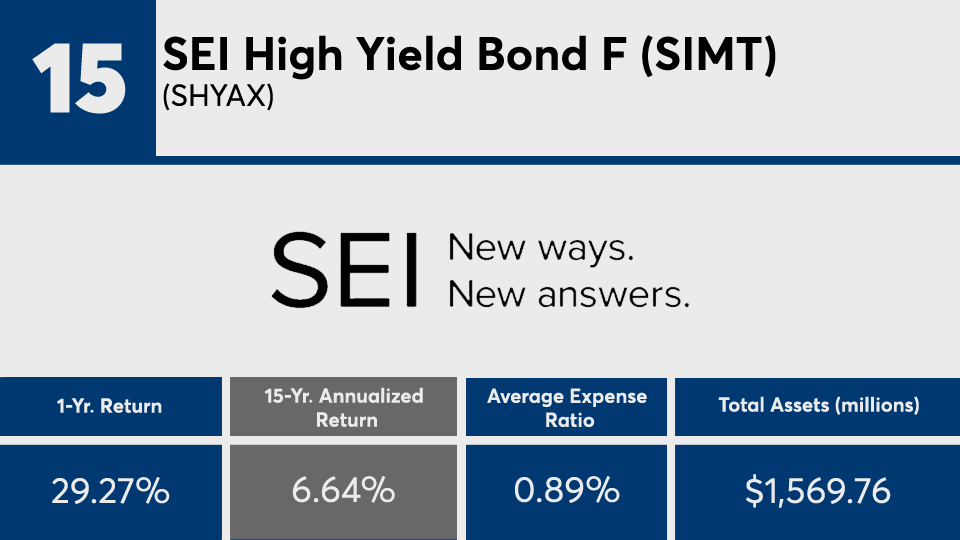
YTD Return: 4.26%; 3-Yr. Annualized Return: 6.68%; 5-Yr. Annualized Return: 8.34%; 10-Yr. Annualized Return: 6.17%; YTD Net Flow: (millions): ($40.33); 1-Yr. Net Flow (millions): ($93.23); 3-Yr. Net Flow (millions): ($301.19); 5-Yr. Net Flow (millions): ($727.33); 10-Yr. Net Flow (millions): ($1,236.19); 15-Yr. Net Flow (millions): ($1,040.26); Minimum Initial Investment: $100,000; Inception Date: Jan. 11, 1995; Manager Names: Donald E. Morgan, Robert L. Cook, Paul A. Karpers, Kevin P. Loome, Thomas G. Hauser, David S. Aniloff, Seth Brufsky, Michael E. Paasche, Thomas J. Gahan, Michael Schafer, Douglas C. Pardon, Kapil Singh and Chris Mathewson
FP041321_14 copy.png
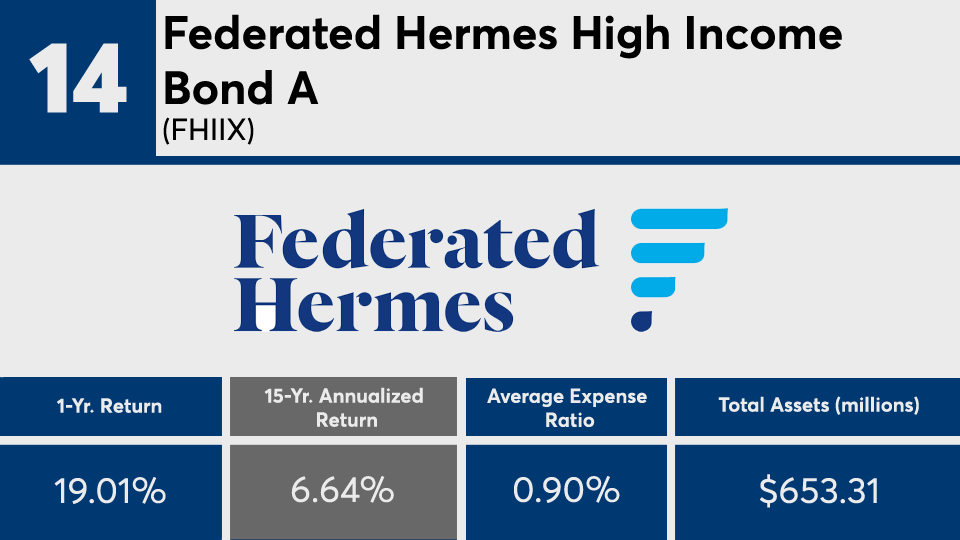
YTD Return: 1.82%; 3-Yr. Annualized Return: 6.41%; 5-Yr. Annualized Return: 6.99%; 10-Yr. Annualized Return: 5.84%; YTD Net Flow: (millions): ($3.33); 1-Yr. Net Flow (millions): ($3.1); 3-Yr. Net Flow (millions): ($97.82); 5-Yr. Net Flow (millions): ($329.8); 10-Yr. Net Flow (millions): ($692.87); 15-Yr. Net Flow (millions): ($795.67); Minimum Initial Investment: $1,500; Front Load: 4.5%; Inception Date: Nov. 30, 1977; Manager Names: Mark E. Durbiano and Steven J. Wagner
FP041321_13 copy.png
YTD Return: -0.92%; 3-Yr. Annualized Return: 6.37%; 5-Yr. Annualized Return: 6.48%; 10-Yr. Annualized Return: 5.88%; YTD Net Flow: (millions): $32.91; 1-Yr. Net Flow (millions): $10.64; 3-Yr. Net Flow (millions): $51.84; 5-Yr. Net Flow (millions): ($312.18); 10-Yr. Net Flow (millions): ($2,953.82); 15-Yr. Net Flow (millions): ($1,255.78); Inception Date: March 17, 2000; Manager Names: Scott A. Mather and David L. Braun
FP041321_12 copy.png
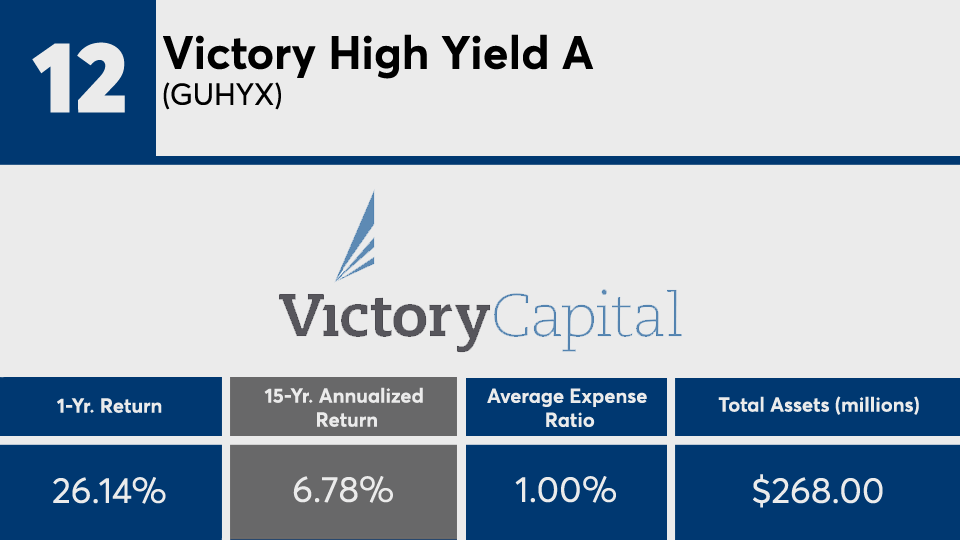
YTD Return: 2.55%; 3-Yr. Annualized Return: 8.09%; 5-Yr. Annualized Return: 9.42%; 10-Yr. Annualized Return: 6.43%; YTD Net Flow: (millions): $3.35; 1-Yr. Net Flow (millions): $7.99; 3-Yr. Net Flow (millions): $15.07; 5-Yr. Net Flow (millions): $3.61; 10-Yr. Net Flow (millions): ($61); 15-Yr. Net Flow (millions): ($56.19); Minimum Initial Investment: $2,500; Front Load: 2.25%; Inception Date: Sept. 1, 1998; Manager Names: John Blaney and Andrew Liggio
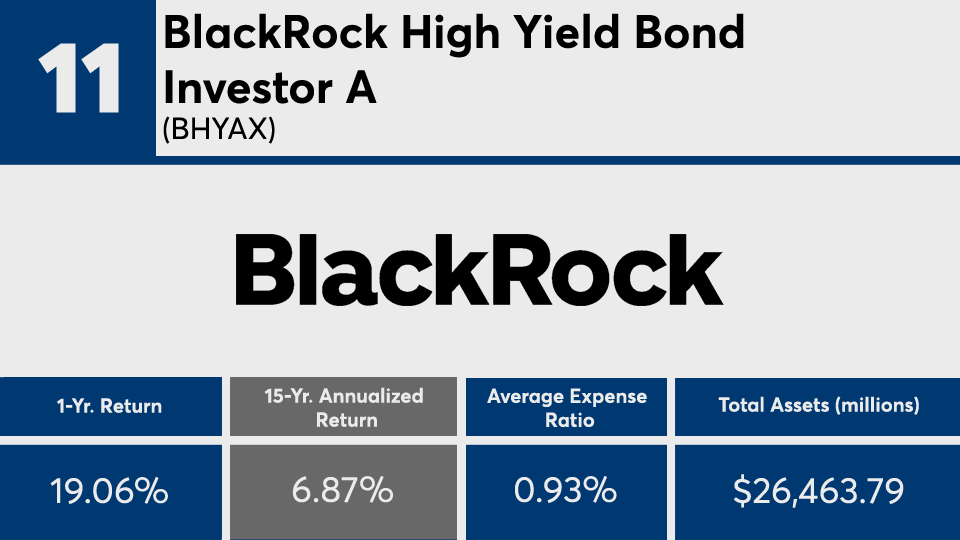
FP041321_11 copy.png
YTD Return: 1.63%; 3-Yr. Annualized Return: 6.21%; 5-Yr. Annualized Return: 7.47%; 10-Yr. Annualized Return: 6.04%; YTD Net Flow: (millions): ($10.87); 1-Yr. Net Flow (millions): $74.39; 3-Yr. Net Flow (millions): ($169.34); 5-Yr. Net Flow (millions): ($2,126.14); 10-Yr. Net Flow (millions): ($1,628.13); 15-Yr. Net Flow (millions): ($722.64); Minimum Initial Investment: $1,000; Front Load: 4%; Inception Date: Nov. 19, 1998; Manager Names: James Keenan, David Delbos, Mitchell S. Garfin and Derek Schoenhofen
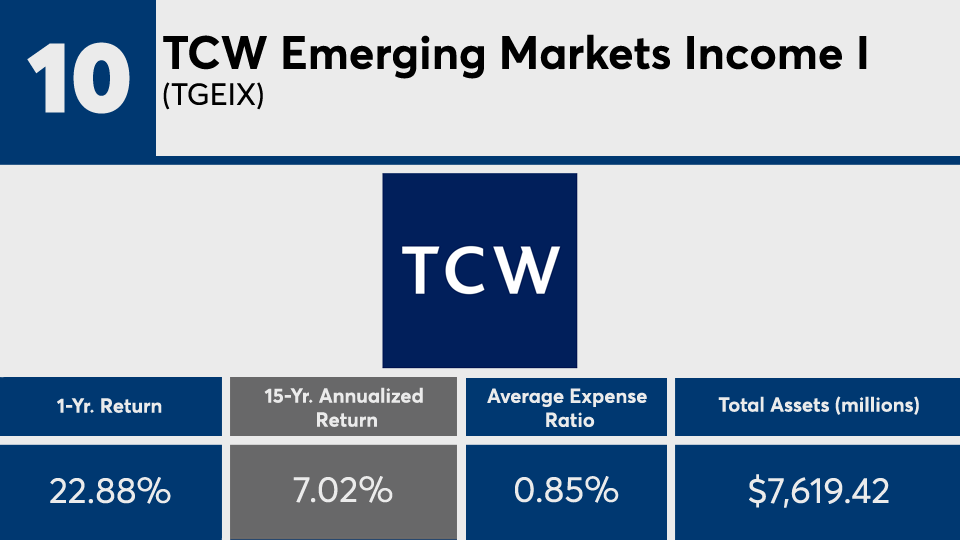
FP041321_10 copy.png
YTD Return: -3.77%; 3-Yr. Annualized Return: 3.58%; 5-Yr. Annualized Return: 6.02%; 10-Yr. Annualized Return: 4.61%; YTD Net Flow: (millions): $361.89; 1-Yr. Net Flow (millions): $357.35; 3-Yr. Net Flow (millions): $3,090.39; 5-Yr. Net Flow (millions): $3,718.48; 10-Yr. Net Flow (millions): $4,747.04; 15-Yr. Net Flow (millions): $5,726.82; Minimum Initial Investment: $2,000; Inception Date: May 29, 1998; Manager Names: Penelope D. Foley, David I. Robbins, Javier Segovia and Alex Stanojevic
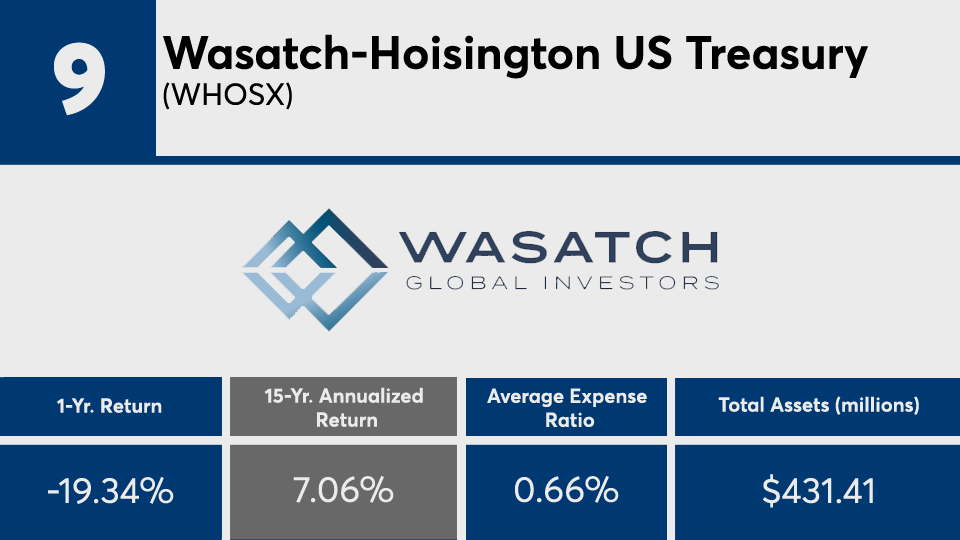
FP041321_9 copy.png
YTD Return: -15.06%; 3-Yr. Annualized Return: 6.6%; 5-Yr. Annualized Return: 2.87%; 10-Yr. Annualized Return: 7.58%; YTD Net Flow: (millions): ($22.3); 1-Yr. Net Flow (millions): $101.77; 3-Yr. Net Flow (millions): $42.34; 5-Yr. Net Flow (millions): $11.75; 10-Yr. Net Flow (millions): $138.87; 15-Yr. Net Flow (millions): $71.61; Minimum Initial Investment: $2,000; Redemption Load: 2%; Inception Date: Dec. 8, 1986; Manager Names: Van Robert Hoisington, Van R. Hoisington and David M. Hoisington
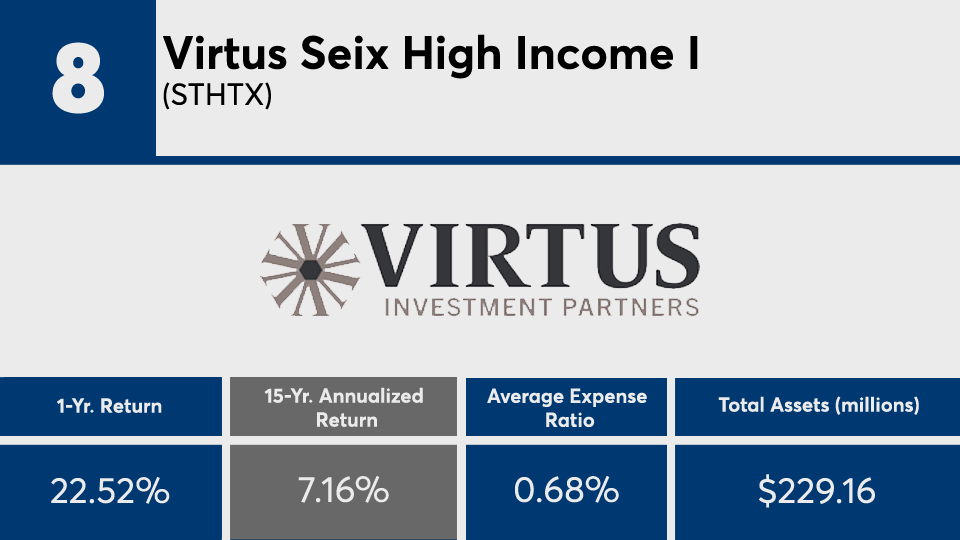
FP041321_8 copy.png
YTD Return: 1.65%; 3-Yr. Annualized Return: 6.09%; 5-Yr. Annualized Return: 7.67%; 10-Yr. Annualized Return: 5.57%; YTD Net Flow: (millions): ($6.9); 1-Yr. Net Flow (millions): ($7.82); 3-Yr. Net Flow (millions): ($155.8); 5-Yr. Net Flow (millions): ($453.74); 10-Yr. Net Flow (millions): ($334.26); 15-Yr. Net Flow (millions): ($21.7); Minimum Initial Investment: $100,000; Inception Date: Oct. 3, 2001; Manager Names: Michael Kirkpatrick and James FitzPatrick
FP041321_7 copy.png
YTD Return: -8.08%; 3-Yr. Annualized Return: 7.98%; 5-Yr. Annualized Return: 6.15%; 10-Yr. Annualized Return: 7.69%; YTD Net Flow: (millions): $13.66; 1-Yr. Net Flow (millions): ($14.18); 3-Yr. Net Flow (millions): $67.22; 5-Yr. Net Flow (millions): $699.27; 10-Yr. Net Flow (millions): $2,449.55; 15-Yr. Net Flow (millions): $5,700.67; Minimum Initial Investment: $50,000; Inception Date: Feb. 12, 2001; Manager Names: Scott I. St. John, Daniel Shaykevich, Samuel C. Martinez, Arvind Narayanan
FP041321_6 copy.png
YTD Return: 2.35%; 3-Yr. Annualized Return: 7.44%; 5-Yr. Annualized Return: 8.16%; 10-Yr. Annualized Return: 6.63%; YTD Net Flow: (millions): $1,068.05; 1-Yr. Net Flow (millions): $5,135.74; 3-Yr. Net Flow (millions): $7,158.06; 5-Yr. Net Flow (millions): $8,239.13; 10-Yr. Net Flow (millions): $9,590.95; 15-Yr. Net Flow (millions): $9,855.75; Inception Date: March 1, 1996; Manager Names: Robert Cignarella, Brian Clapp, Robert Spano, Ryan Kelly and Daniel Thorogood
FP041321_5 copy.png
YTD Return: 4.17%; 3-Yr. Annualized Return: 7.26%; 5-Yr. Annualized Return: 8.73%; 10-Yr. Annualized Return: 6.87%; YTD Net Flow: (millions): $34.44; 1-Yr. Net Flow (millions): $132.83; 3-Yr. Net Flow (millions): ($521); 5-Yr. Net Flow (millions): ($504.26); 10-Yr. Net Flow (millions): ($308.2); 15-Yr. Net Flow (millions): $347.41; Minimum Initial Investment: $100,000; Inception Date: Dec. 5, 2005; Manager Names: Donald E. Morgan, Robert L. Cook, Paul A. Karpers, Kevin P. Loome, Thomas G. Hauser, David S. Aniloff, Seth Brufsky, Michael E. Paasche, Thomas J. Gahan, Michael Schafer, Douglas C. Pardon, Kapil Singh and Chris Matthewson
FP041321_4 copy.png
YTD Return: 5.5%; 3-Yr. Annualized Return: 9%; 5-Yr. Annualized Return: 9.85%; 10-Yr. Annualized Return: 7.33%; YTD Net Flow: (millions): $95.36; 1-Yr. Net Flow (millions): $56.61; 3-Yr. Net Flow (millions): ($256.53); 5-Yr. Net Flow (millions): ($288.65); 10-Yr. Net Flow (millions): ($215.73); 15-Yr. Net Flow (millions): ($328.34); Inception Date: July 3, 1995; Manager Names: Mark Notkin and Brian Chang
FP041321_3 copy.png
YTD Return: 5.33%; 3-Yr. Annualized Return: 9.47%; 5-Yr. Annualized Return: 9.85%; 10-Yr. Annualized Return: 7.19%; YTD Net Flow: (millions): $974.69; 1-Yr. Net Flow (millions): $900.3; 3-Yr. Net Flow (millions): ($619.88); 5-Yr. Net Flow (millions): ($645.25); 10-Yr. Net Flow (millions): ($3,152.87); 15-Yr. Net Flow (millions): ($2,878.46); Inception Date: Nov. 1, 1977; Manager Names: Mark Notkin and Brian Chang
FP041321_2 copy.png
YTD Return: -1.75%; 3-Yr. Annualized Return: 6.64%; 5-Yr. Annualized Return: 3.46%; 10-Yr. Annualized Return: 6.47%; YTD Net Flow: (millions): $5.38; 1-Yr. Net Flow (millions): $17.75; 3-Yr. Net Flow (millions): $6.03; 5-Yr. Net Flow (millions): ($54.53); 10-Yr. Net Flow (millions): ($65.52); 15-Yr. Net Flow (millions): ($273.8); Minimum Initial Investment: $2,500; Inception Date: Feb. 15, 1996; Manager Names: Robert V. Gahagan, Brian Howell, James E. Platz and Miguel Castillo
FP041321_1 copy.png
YTD Return: -2.87%; 3-Yr. Annualized Return: 5.57%; 5-Yr. Annualized Return: 4.87%; 10-Yr. Annualized Return: 4.54%; YTD Net Flow: (millions): $22.32; 1-Yr. Net Flow (millions): $30.74; 3-Yr. Net Flow (millions): $70.54; 5-Yr. Net Flow (millions): ($217.03); 10-Yr. Net Flow (millions): ($2,729.09); 15-Yr. Net Flow (millions): ($1,693.12); Inception Date: March 17, 2000; Manager Names: Scott A. Mather and David L. Braun
MORE FROM FINANCIAL PLANNING