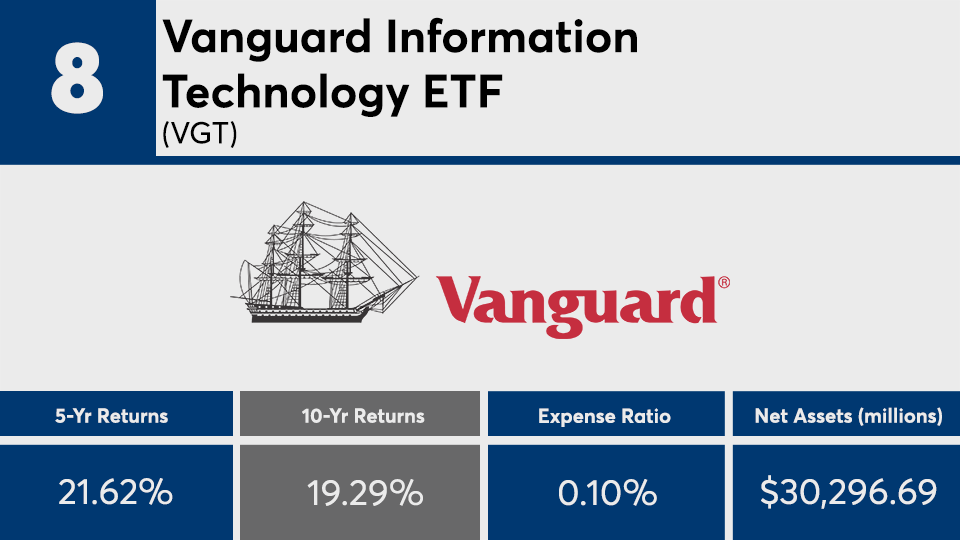
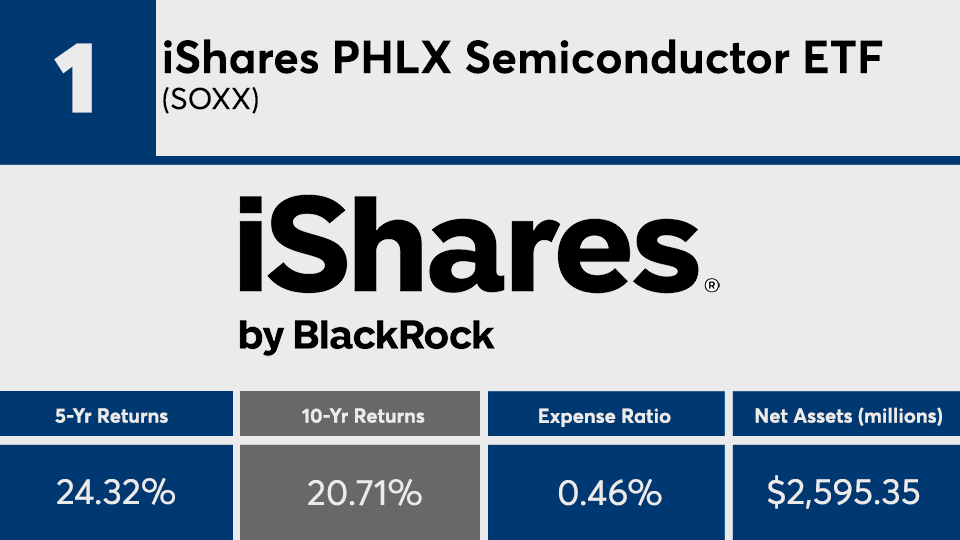
Market-beating returns and low fees: These are just some of the characteristics associated with the decade’s top-performing index funds.
Largely comprised of holdings in technology, the 20 index funds with the largest gains of the past decade recorded an average return of more than 19%, Morningstar Direct data show.
Although broader equity markets had impressive gains of their own in the last 10 years, the average return from the winners beats the S&P 500’s 14.01% return, as tracked by SPDR S&P 500 ETF Trust (SPY), as well as the 13.53% gain by the Dow, as measured by the SPDR Dow Jones Industrial Average ETF Trust (DIA), data show.
“The past decade saw huge shifts in the fund industry. It all began in the wake of the 2007-2009 credit crisis,” Morningstar senior manager research analyst Kevin McDevitt and associate manager research analyst Nick Watson wrote in a recent paper on fund industry flows. “The decade saw the Federal Reserve’s most-stimulative monetary policy in U.S. history. There was the longest ongoing equity bull market in history, in which the S&P 500 Index gained an annualized 13.6% over the past 10 years. Finally, the decade saw a massive demographic shift as baby boomers began to retire en masse.”
Fees among the top-performers were right on par with the rest of the fund industry. At 0.48%, the funds carried a net expense ratio that matched the broader industry average, according to Morningstar’s most recent annual fee survey, which reviewed the asset-weighted average expense ratios of all U.S. open-end mutual funds and ETFs. The industry’s largest overall fund, the $901.9 billion Vanguard Total Stock Market Index Fund Admiral Shares (VTSAX), had a 0.14% expense ratio and a 30.08% return in 2019, data show.
“There are nonperformance reasons for preferring index funds, such as transparency, ease of selection, and less need for monitoring,” John Rekenthaler, vice president of research for Morningstar, wrote in a recent paper on the impact of fees on index fund investing. “There is no question that the practice of indexing confers many benefits. But higher total returns are not among them, if the active fund dares to match the indexer's costs.”
Scroll through to see the 20 index funds with the biggest gains over 10 years through Feb.13. Funds with less than $100 million in AUM and investment minimums over $100,000 were excluded, as were leveraged and institutional funds. Assets and expense ratios are listed for each, as well as one-, three- and five-year returns. The data show each fund's primary share class. All data from Morningstar Direct.


