Investors who reaped the benefits of the decade’s top-performing large-cap funds may soon want to know what happened to their steady returns.
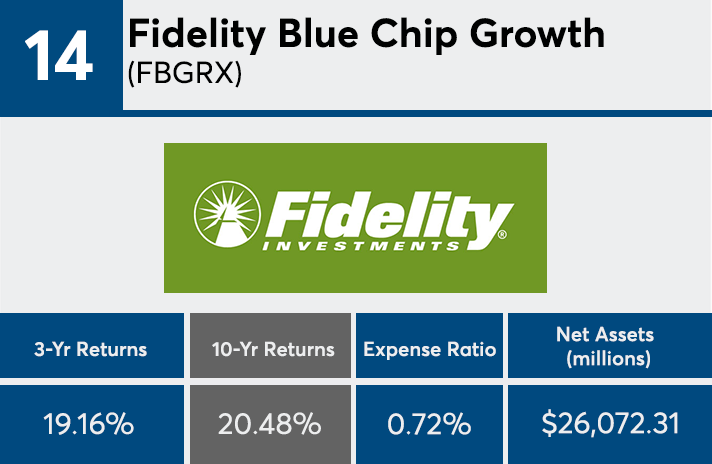
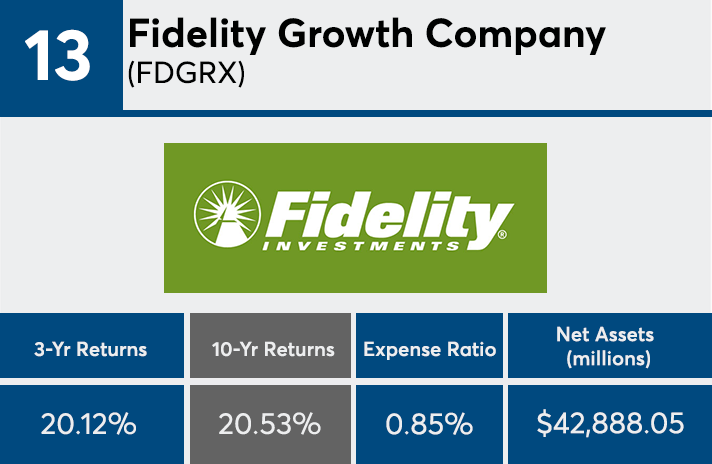
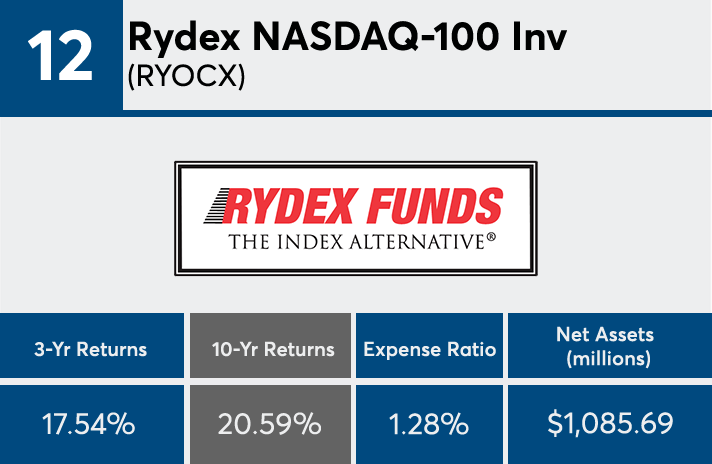
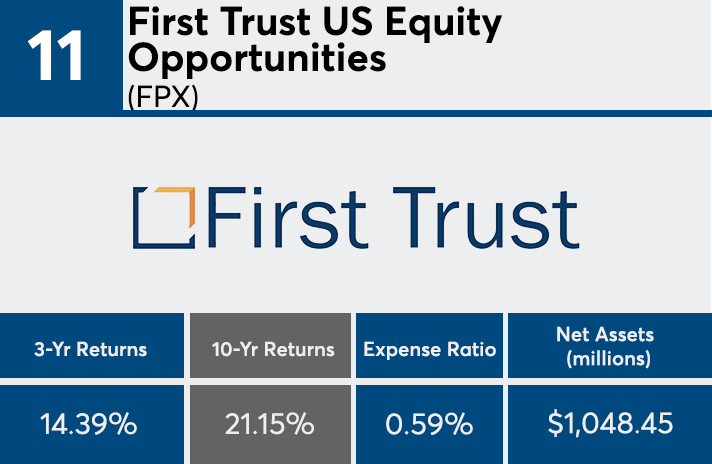
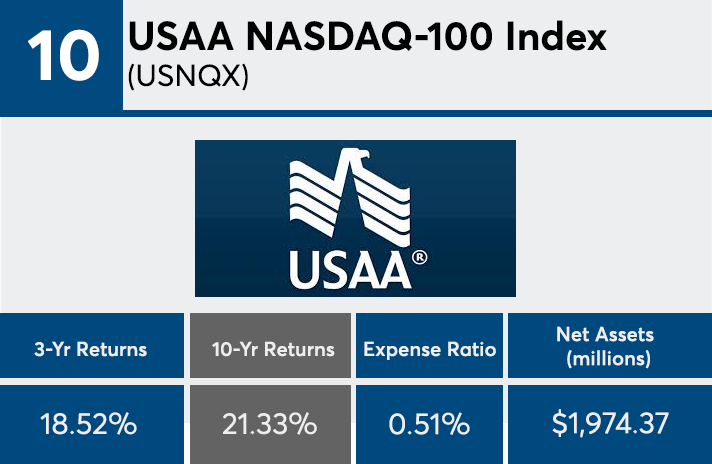
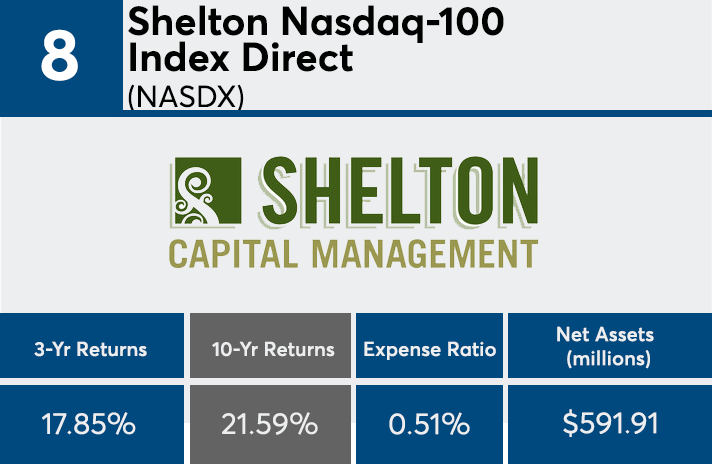
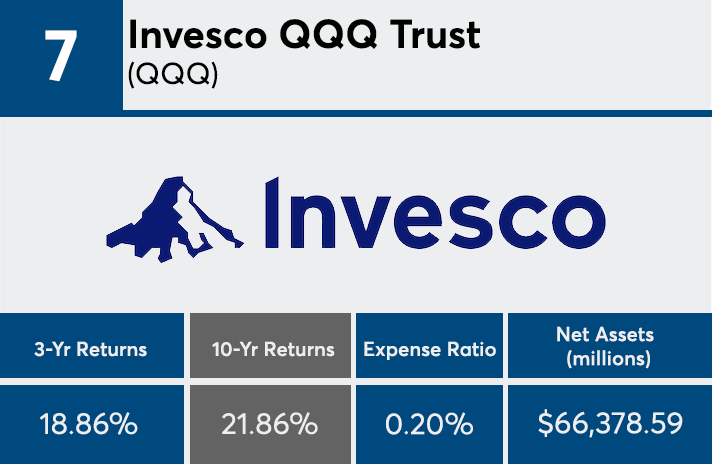
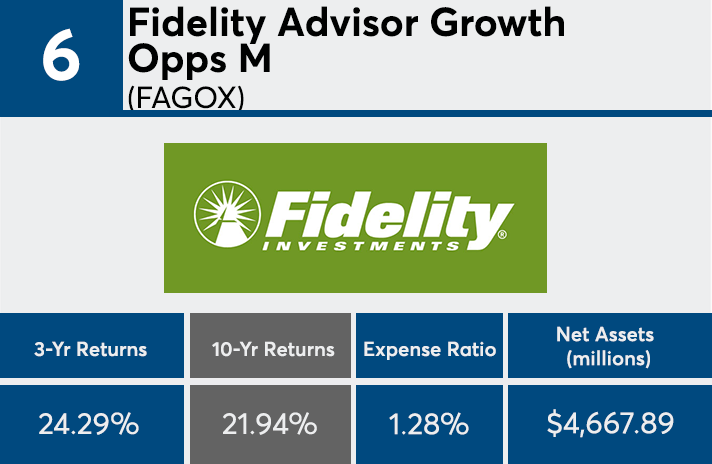
With nearly a quarter-trillion dollars in combined AUM, large-cap funds with the best 10-year returns (with at least $500 million in AUM) are starting to falter, Morningstar Direct data show. While these mutual funds and ETFs posted an average 10-year return of over 21%, three-year figures were about 18.5%. Over the past year, these same funds had an average return of roughly 3.4%. Growth stock funds dominate the list.
“While the average annual returns of the top-performing funds over a 10-year period were tightly clustered, there was a much greater disparity in returns among those same funds in just the past three years,” says Bankrate’s senior financial analyst, Greg McBride.
Home to more than $249 billion in combined AUM, the top-performers carried significantly higher expense ratios than the industry average. With a range of 21 to 128 basis points, these funds carried an average net expense ratio of 0.75%, data show. That is more than 20 basis points higher than the industry average of 0.52% for fund investing in 2017, according to Morningstar’s most recent annual fee survey, which reviewed the asset-weighted average expense ratios of nearly 25,000 U.S. mutual funds and ETFs.
The industry’s 20 largest large-cap funds, in a similar ranking, posted slightly lower returns; however at a much lower price to investors, data show. With roughly $2.9 trillion in AUM, the biggest funds of the past decade had an average 10-year return of 16.88% and an average expense ratio of 0.40%. With $757 billion in AUM, the biggest large-cap fund — the Vanguard Total Stock Market Index Fund Admiral Class (VTSAX) — had a 17.08% return over the last 10 years, and a 0.04% expense ratio, data show.
Bigger picture, McBride says, “The lesson for investors is that even funds that are strong performers over the long-term can be laggards in the short term — don’t be quick to bail on funds that meet your long-term objectives just because a brief period of sluggish returns.”
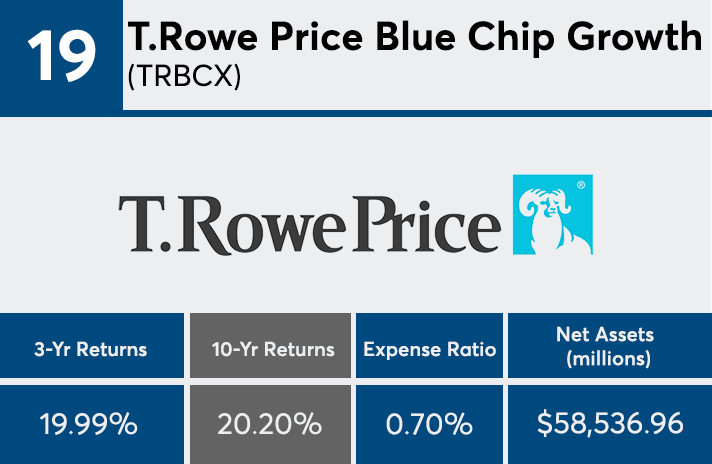
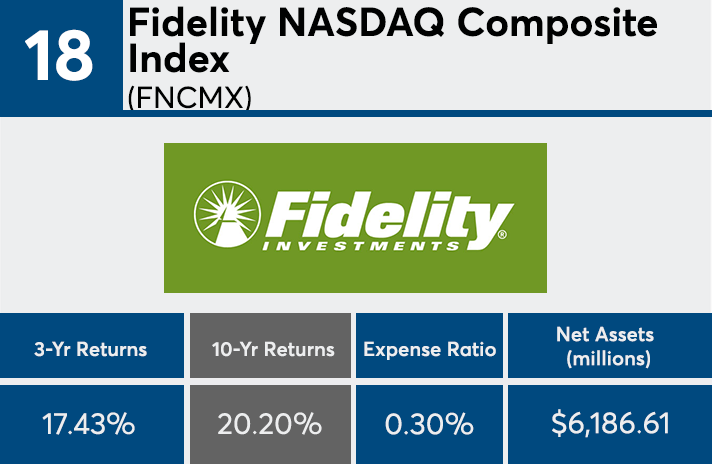
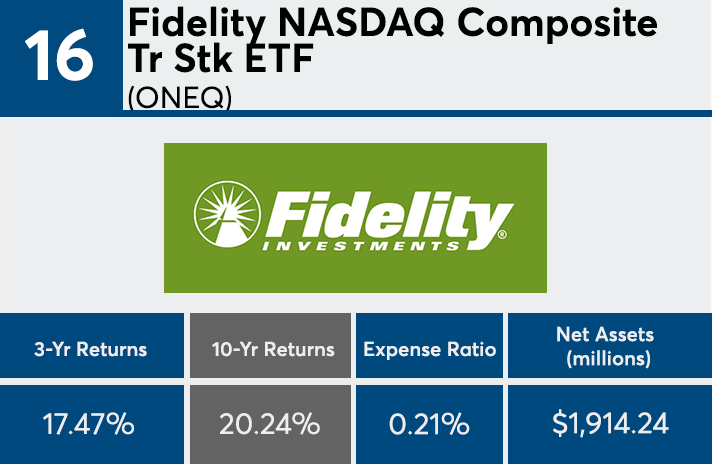
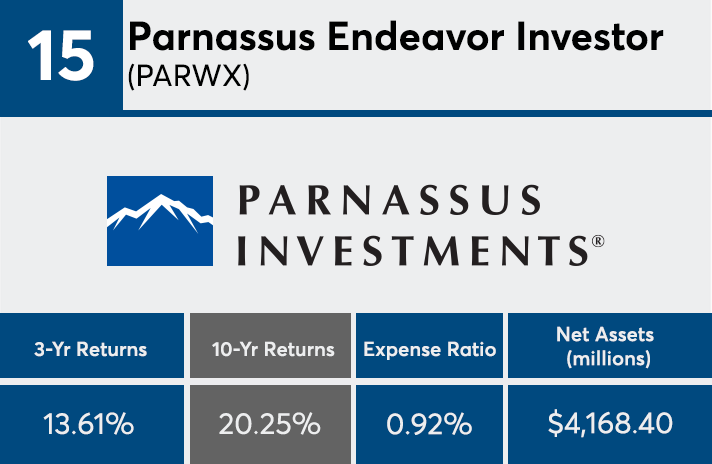
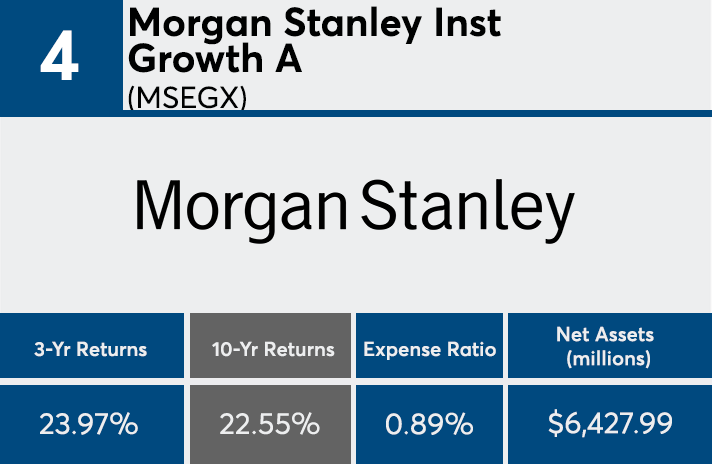
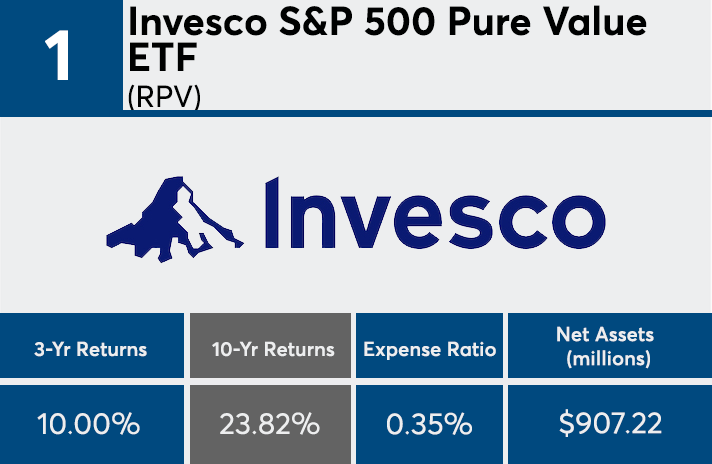
Scroll through to see the 20 large-cap category mutual funds and ETFs with the highest 10-year returns through March 7. Funds with investment minimums over $100,000 were excluded, as were leveraged and institutional funds. Assets and expense ratios for each fund are also listed. The data shows the individual funds’ primary share class. All data from Morningstar Direct.

