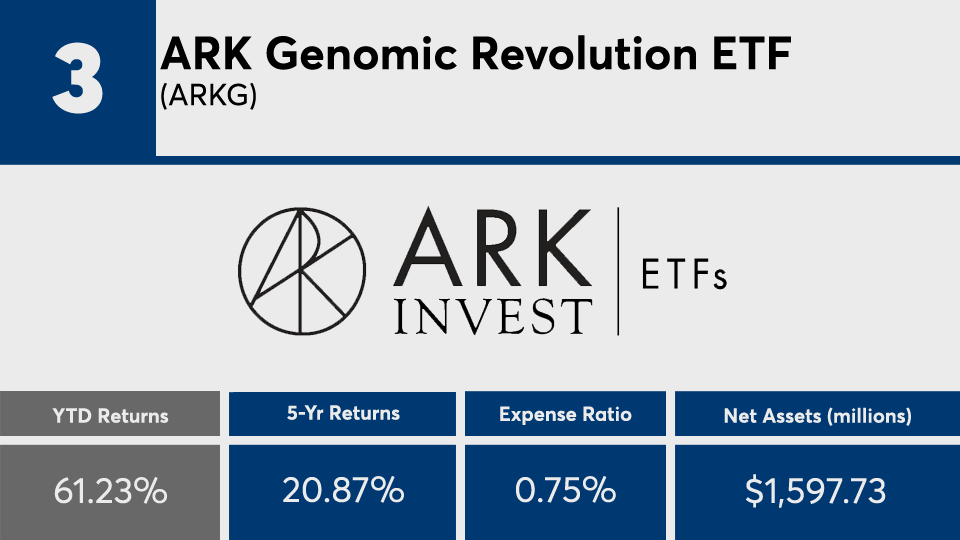
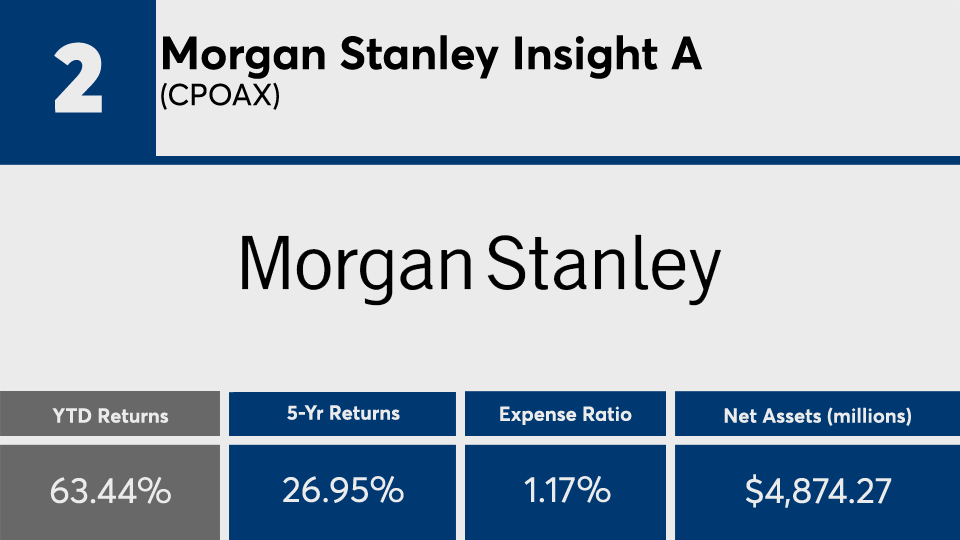
For much of the investment world, gains have been hard to come by in the year of the coronavirus. But for funds at the top, returns have been huge.
With more than $55 billion in combined assets, the 20 mutual funds and ETFs with the biggest gains of 2020 have managed an average return of nearly 52%, according to Morningstar Direct. That is well above the average gains of index trackers like SPY and DIA, which have so far managed a 0.76% gain and 6.33% loss, respectively, over the same period.
“Most stocks are lower this year, and many are lower by double digits, but there are a handful of stocks and sectors that have just completely dominated,” says CLS Investments CIO Marc Pfeffer. “Large-cap stocks like Amazon and Apple have done that going into the pandemic, they have done that well in the pandemic, and they will do well coming out.”
Tracking categories such as large growth, technology and precious metals, the top 20 have also more than doubled the broader industry over the longer term. With a five-year gain of nearly 25%, the funds bested SPY and DIA’s gains of 11.14% and 10.93% over the same period.
In bonds, the iShares Core US Aggregate Bond ETF (AGG) has gained 7.39% year-to-date and 4.40% over five years.
With 14 actively managed funds in the group, there's no surprise that fees for the top 20 are also higher than the industry average. With an average net expense ratio of 0.86%, the funds were nearly double the 0.45% investors paid on average for fund investing overall last year, according to Morningstar’s most recent annual fee survey.
“The lesson here is, depending on what the individual's risk is, you want to stay diversified,” Pfeffer says, adding that, “while it's great that some of these have gone up, diversification and being balanced are still very important things for advisors to focus on with their clients. As much as these have gone up, it's also possible for them to go the other direction, too.”
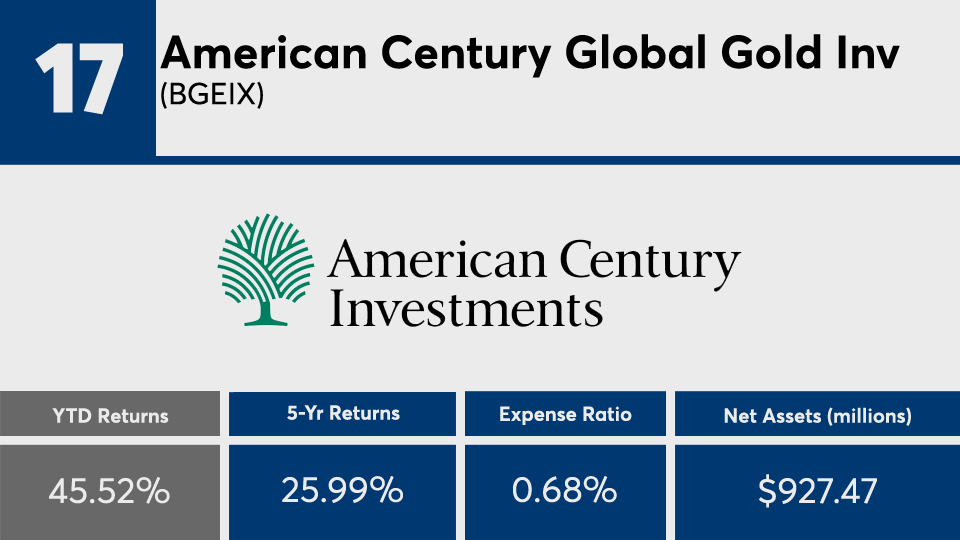
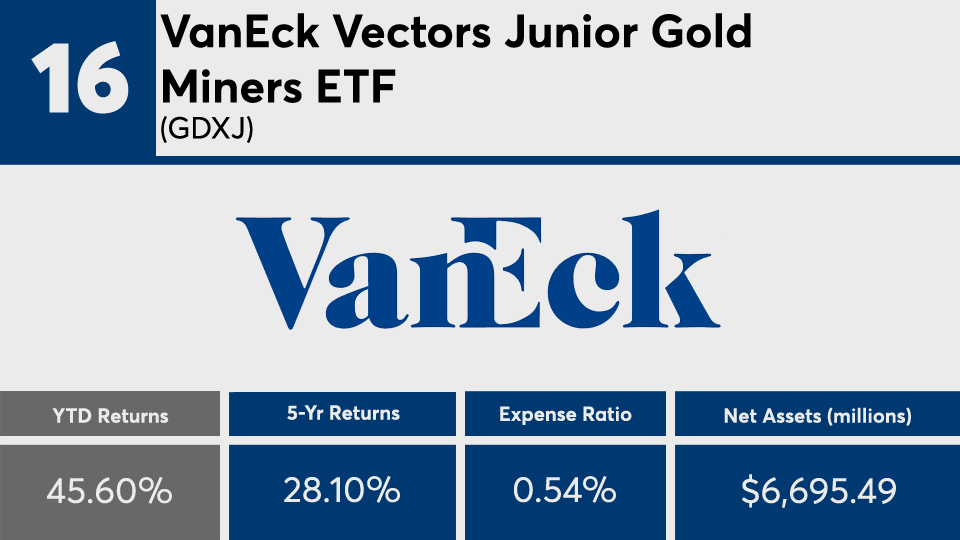
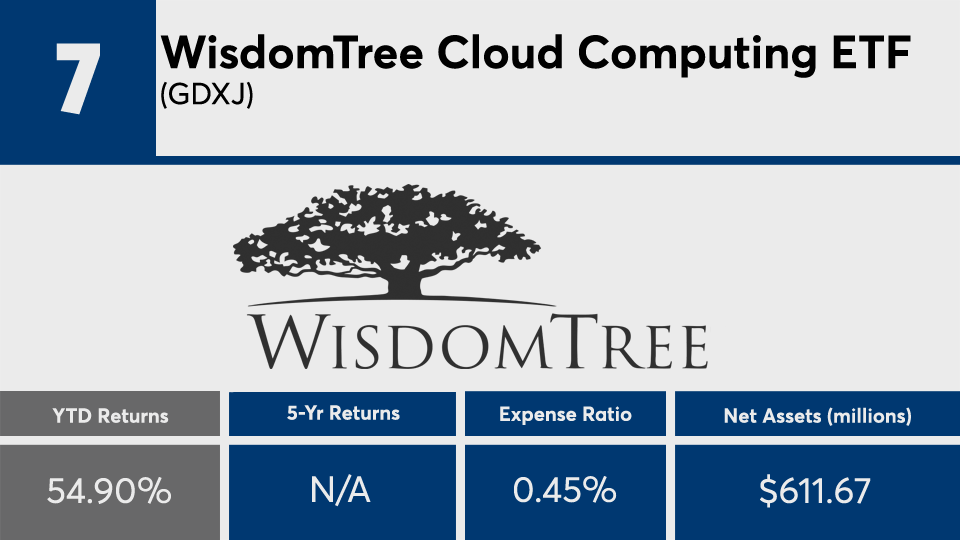
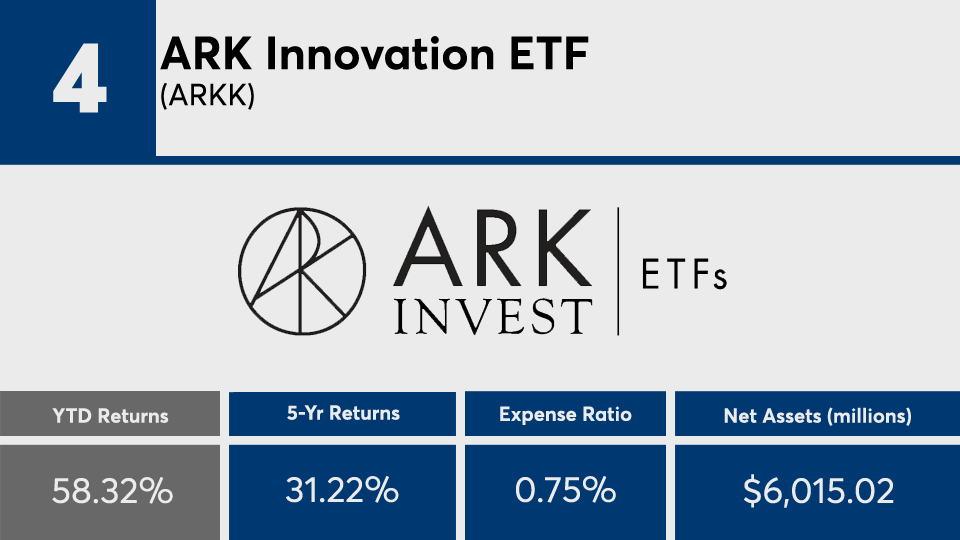
Scroll through to see the 20 mutual funds and ETFs with the biggest year-to-date returns through July 28. Funds with less than $500 million in AUM and with investment minimums over $100,000 were excluded, as were leveraged and institutional funds. Assets and expense ratios, as well as year-to-date and one-, three-, five- and 10-year returns are listed for each. The data show each fund's primary share class. All data is from Morningstar Direct.


