Even the best-performing energy funds suffered 10-year losses

All but one of the decade’s top-performing energy funds have posted losses.

With an overall 10-year loss, it’s safe to say there are no real long-term winners among equity energy and energy-limited partnership category mutual funds and exchange-traded products. The leading 20, with at least $100 million in assets under management, notched an average loss of more than 3.5%, Morningstar Direct data show. The same funds posted a one-year loss of 12.5%.

A look under the hood shows the holdings that make up these sector funds largely track an industry that has failed to transition from fossil fuels to clean and renewable energy, says Peter Krull, founder, CEO and director of investments at Earth Equity Advisors.

“These performance trends are likely to continue as the need to reduce emissions grows greater by the day,” says Krull, adding, “With the Biden administration placing a heavy focus on climate change, investors will be looking to opportunities in a cleaner next economy and eliminating the dinosaurs of fossil fuels and the old economy.”

Compared with the broader fund industry, index trackers such as the SPDR S&P 500 ETF Trust (SPY) and the SPDR Dow Jones Industrial Average ETF Trust (DIA) delivered 10-year annualized gains of 13.66% and 12.43%, respectively, data show. Over the last year, SPY and DIA had returns of 18.39% and 9.22%, respectively.

In bonds, the iShares Core U.S. Aggregate Bond ETF (AGG) recorded gains of 4.14% and 3.72% over the one- and 10-year periods, data show.

The losses from the funds in this ranking carried a hefty price tag. With an average net expense ratio of more than 80 basis points, energy funds with the best 10-year returns were well above the 0.45% investors paid for fund investing in 2019, according to Morningstar’s most recent annual fee survey.

Though advisors often deal with long-term investment strategies, that doesn’t necessarily mean they should ignore overarching trends in the short term, Krull says.

“Financial advisors should keep in mind the changing nature of the global economy as they consider adding specific sectors to their client portfolios,” he says.

Scroll through to see the 20 equity energy and equity limited partnership category mutual funds and ETPs, with more than $100 million in AUM, and the biggest 10-year annualized gains. Assets and average expense ratios, as well as one-, three- and five-year returns through Feb. 15 are also listed for each. The data show each fund's primary share class and current portfolio manager or managers. All data is from Morningstar Direct.
FP021621_20 copy.png

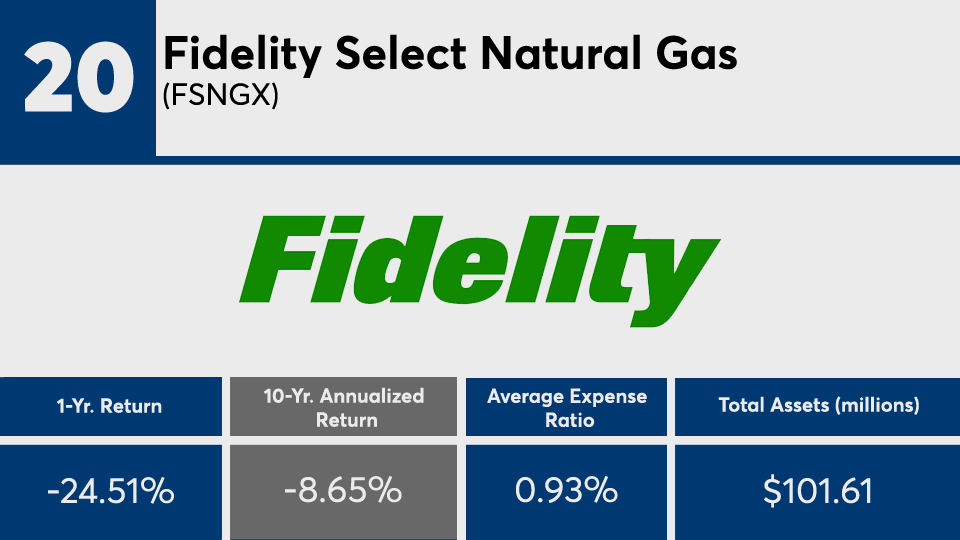
Fidelity Select Natural Gas (FSNGX)

YTD Return: 13.71%
3-Yr. Annualized Return: -17.02%
5-Yr. Annualized Return: -5.31%
FP021621_19 copy.png

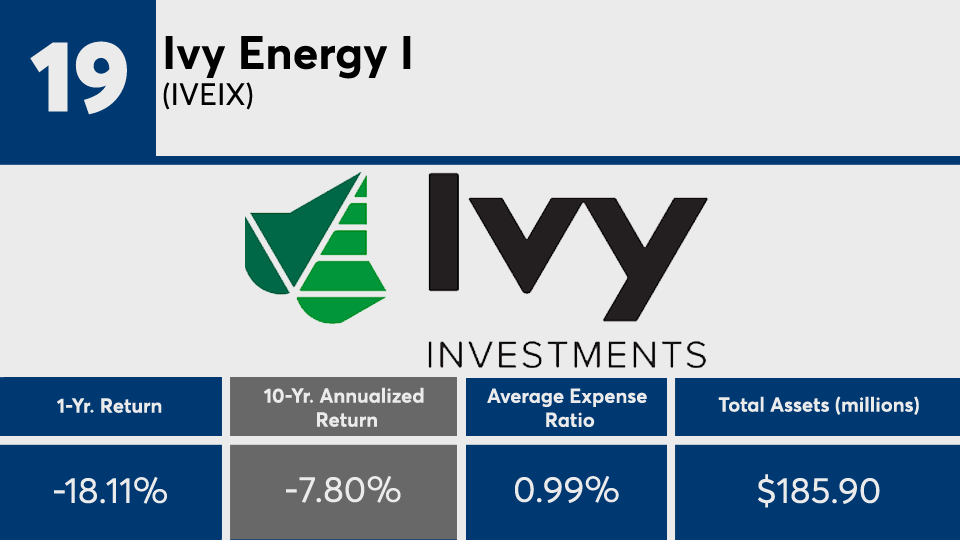
Ivy Energy I (IVEIX)

YTD Return: 17.05%
3-Yr. Annualized Return: -18.22%
5-Yr. Annualized Return: -7.29%
FP021621_18 copy.png

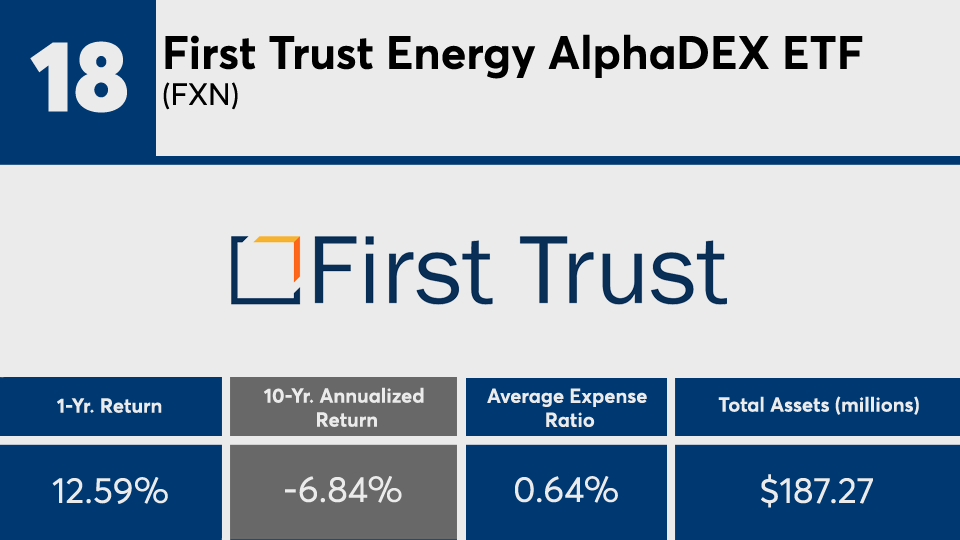
First Trust Energy AlphaDEX ETF (FXN)

YTD Return: 19.29%
3-Yr. Annualized Return: -8.72%
5-Yr. Annualized Return: -1.06%
FP021621_17 copy.png

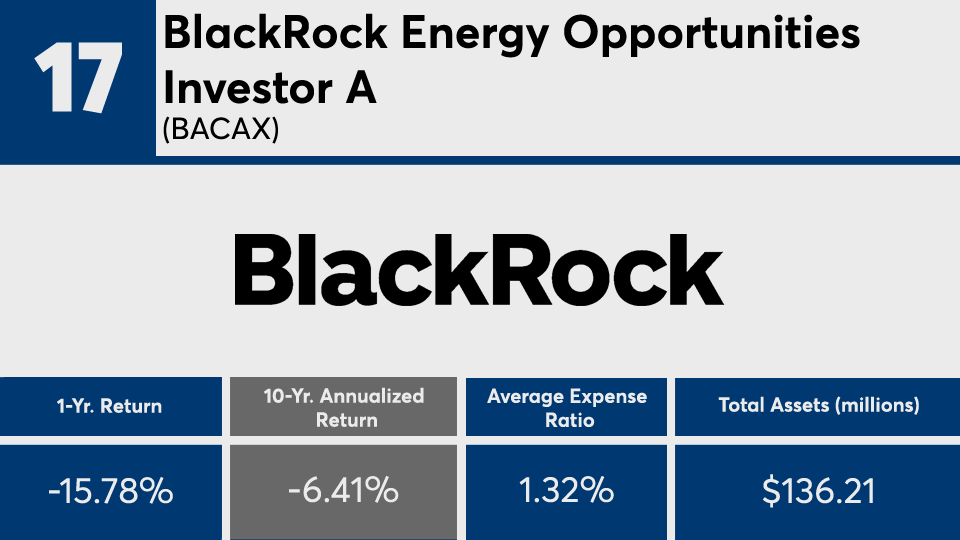
BlackRock Energy Opportunities Investor A (BACAX)

YTD Return: 10.18%
3-Yr. Annualized Return: -8.93%
5-Yr. Annualized Return: -0.53%
Minimum Initial Investment: $1,000
Front Load: 5.25%
FP021621_16 copy.png

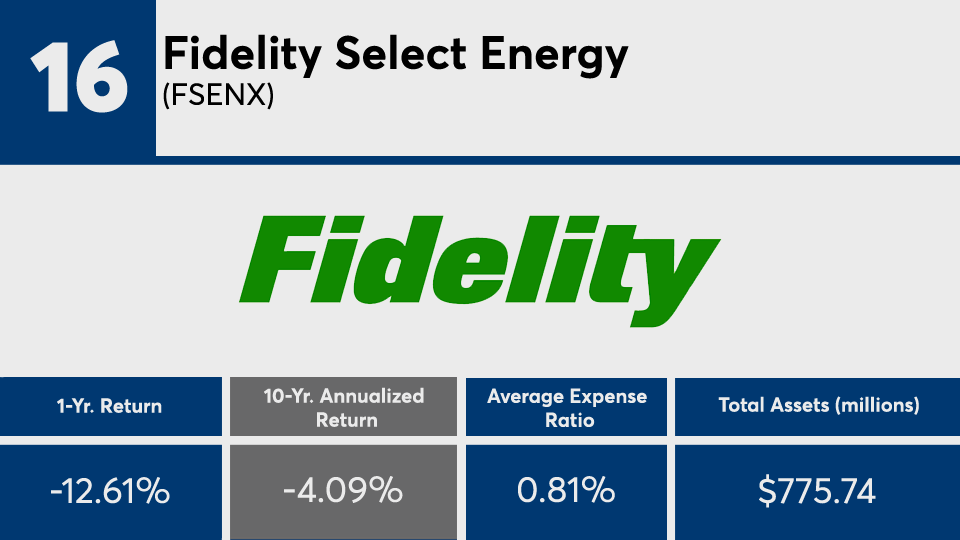
Fidelity Select Energy (FSENX)

YTD Return: 16.62%
3-Yr. Annualized Return: -11.13%
5-Yr. Annualized Return: -1.23%
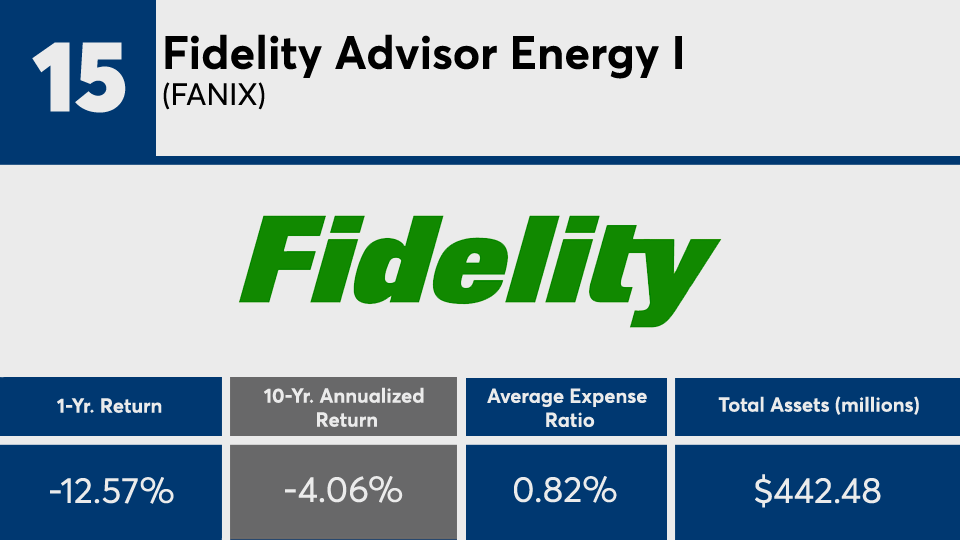
FP021621_15 copy.png

Fidelity Advisor Energy I (FANIX)

YTD Return: 16.79%
3-Yr. Annualized Return: -11.01%
5-Yr. Annualized Return: -1.21%
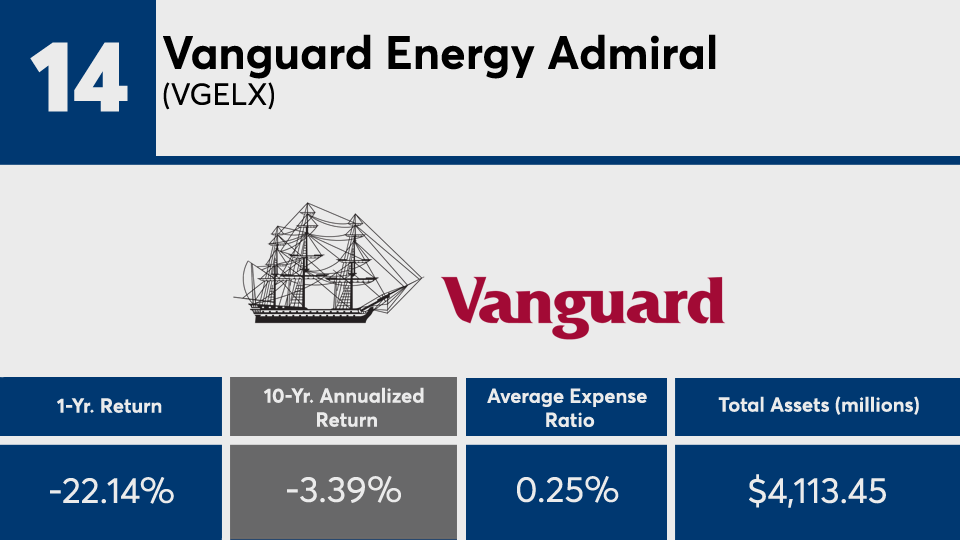
FP021621_14 copy.png

Vanguard Energy Admiral (VGELX)

YTD Return: 5.4%
3-Yr. Annualized Return: -10.37%
5-Yr. Annualized Return: 0.2%
Minimum Initial Investment: $50,000
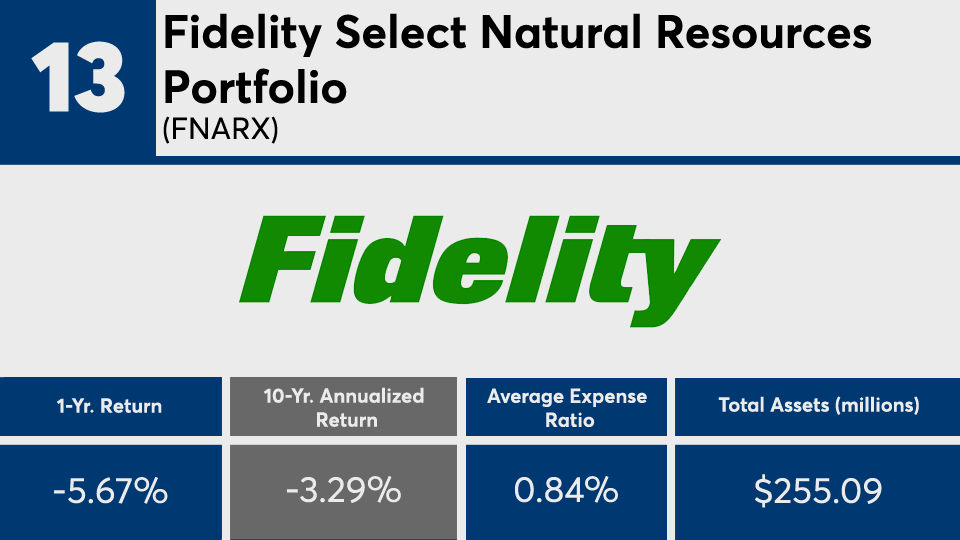
FP021621_13 copy.png

Fidelity Select Natural Resources Portfolio (FNARX)

YTD Return: 9.23%
3-Yr. Annualized Return: -5.61%
5-Yr. Annualized Return: 2.73%
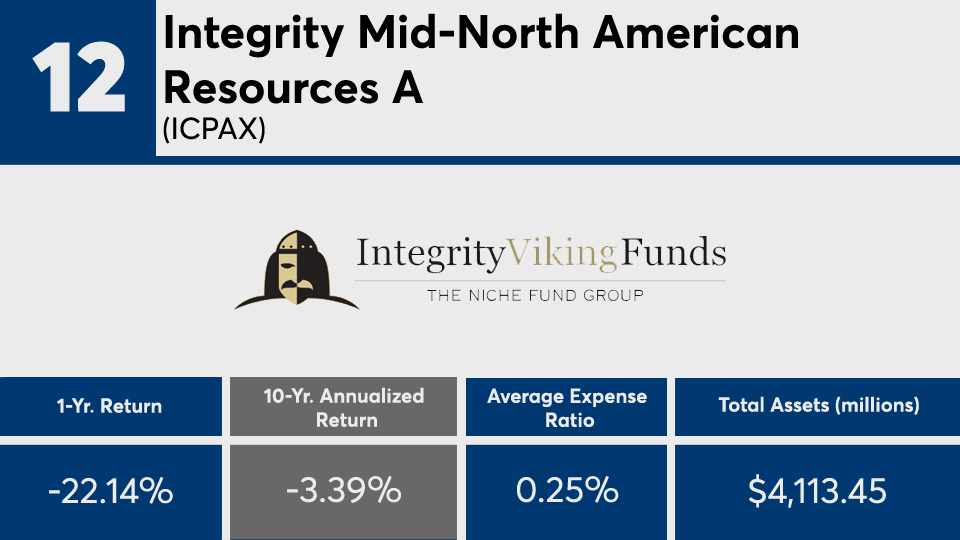
FP021621_12 copy.png

Integrity Mid-North American Resources A (ICPAX)

YTD Return: 16.03%
3-Yr. Annualized Return: -8.59%
5-Yr. Annualized Return: 0.04%
Minimum Initial Investment: $1,000
Front Load: 5%
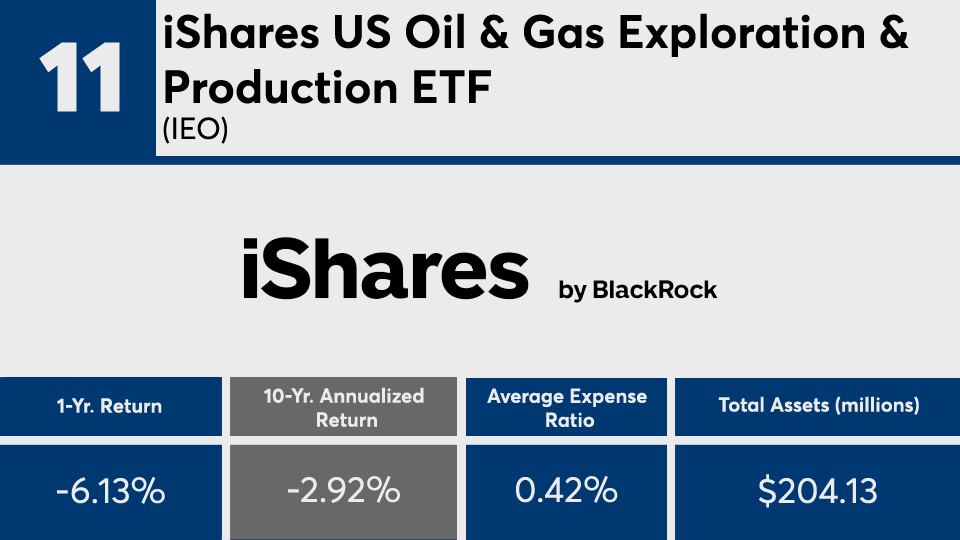
FP021621_11 copy.png

iShares US Oil & Gas Exploration & Production ETF (IEO)

YTD Return: 22.39%
3-Yr. Annualized Return: -8%
5-Yr. Annualized Return: 2.27%
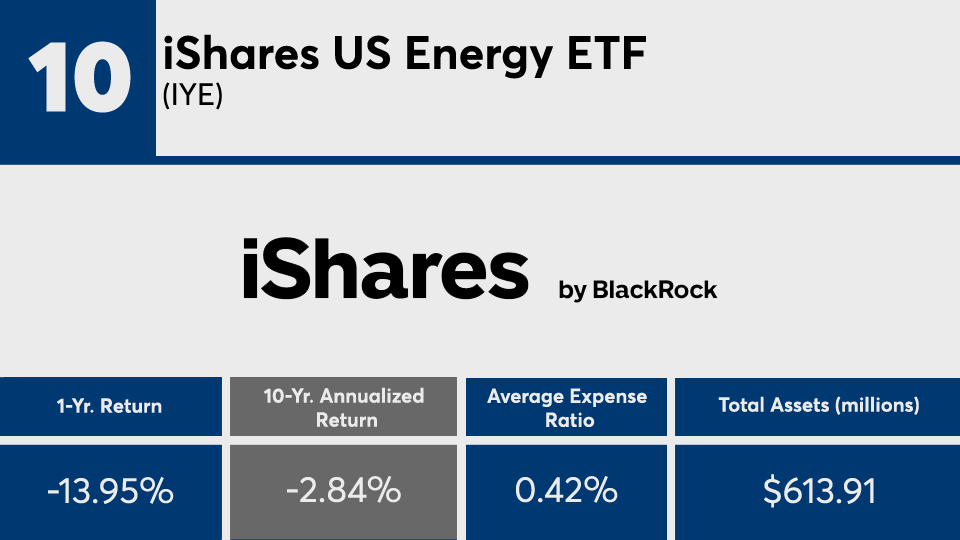
FP021621_10 copy.png

iShares US Energy ETF (IYE)

YTD Return: 17.73%
3-Yr. Annualized Return: -9.37%
5-Yr. Annualized Return: -1.43%
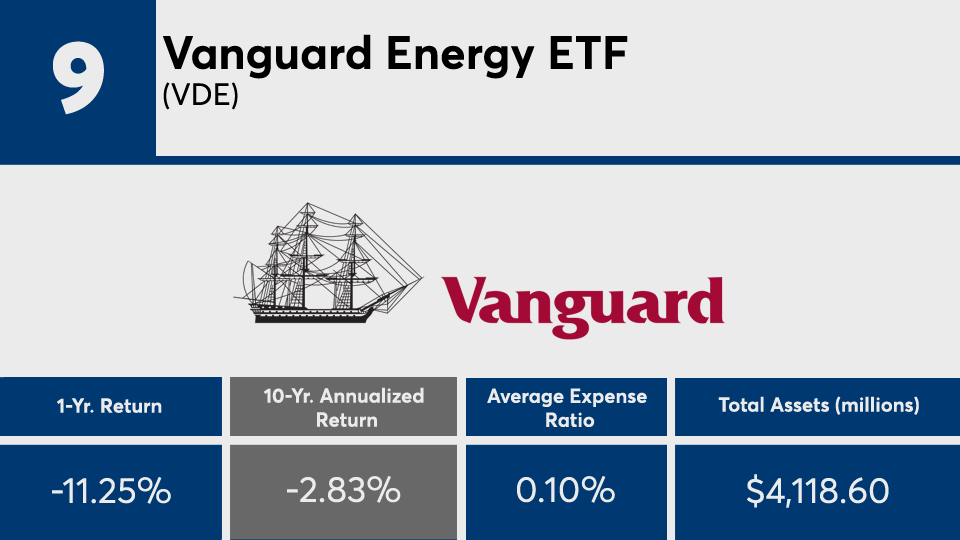
FP021621_9 copy.png

Vanguard Energy ETF (VDE)

YTD Return: 19.73%
3-Yr. Annualized Return: -9.13%
5-Yr. Annualized Return: -0.73%
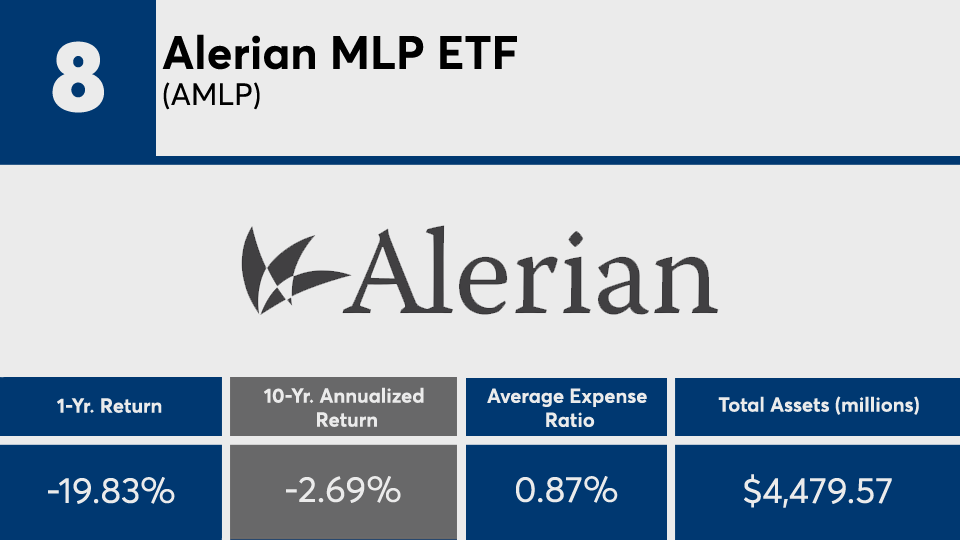
FP021621_8 copy.png

Alerian MLP ETF (AMLP)

YTD Return: 12.6%
3-Yr. Annualized Return: -11.44%
5-Yr. Annualized Return: 0.36%
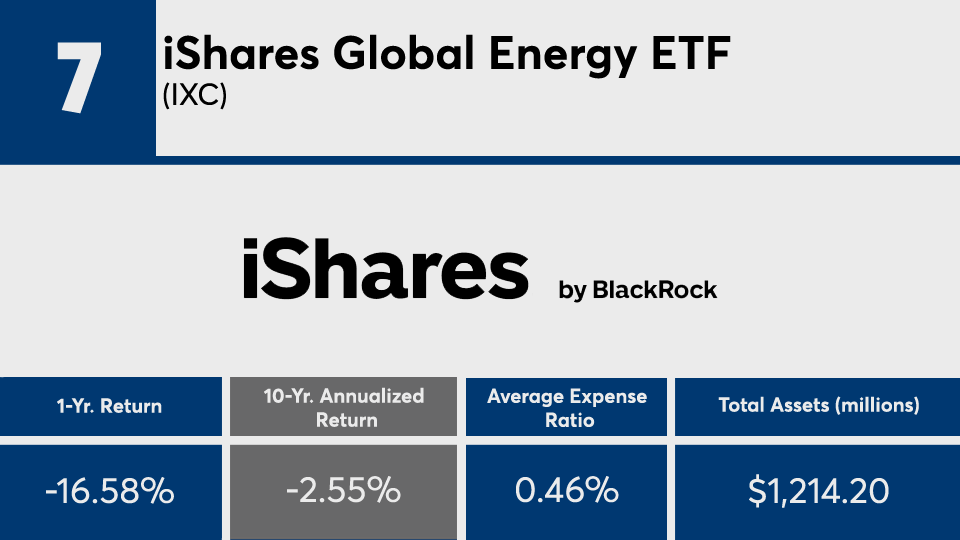
FP021621_7 copy.png

iShares Global Energy ETF (IXC)

YTD Return: 11.58%
3-Yr. Annualized Return: -7.72%
5-Yr. Annualized Return: 1.41%
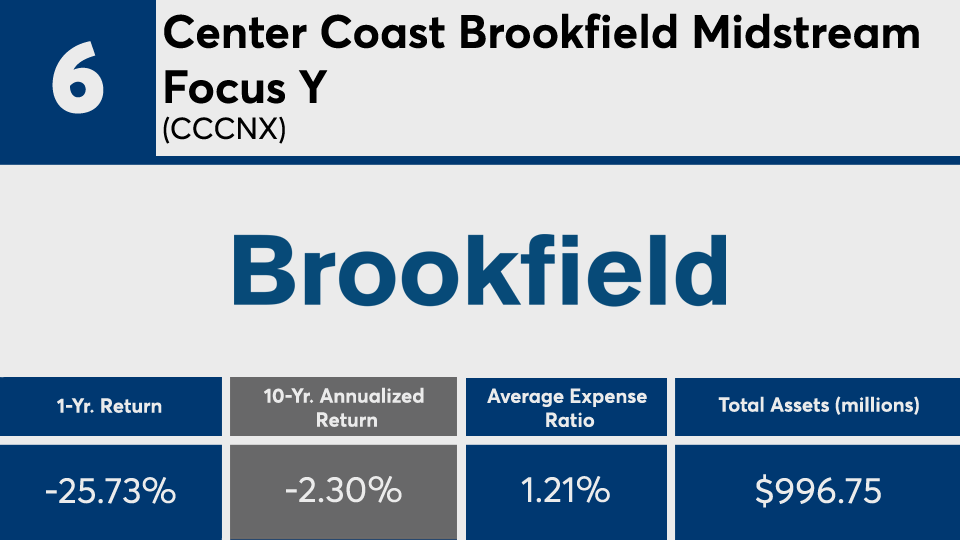
FP021621_6 copy.png

Center Coast Brookfield Midstream Focus Y (CCCNX)

YTD Return: 10.72%
3-Yr. Annualized Return: -13.37%
5-Yr. Annualized Return: -0.4%
Minimum Initial Investment: $1,000
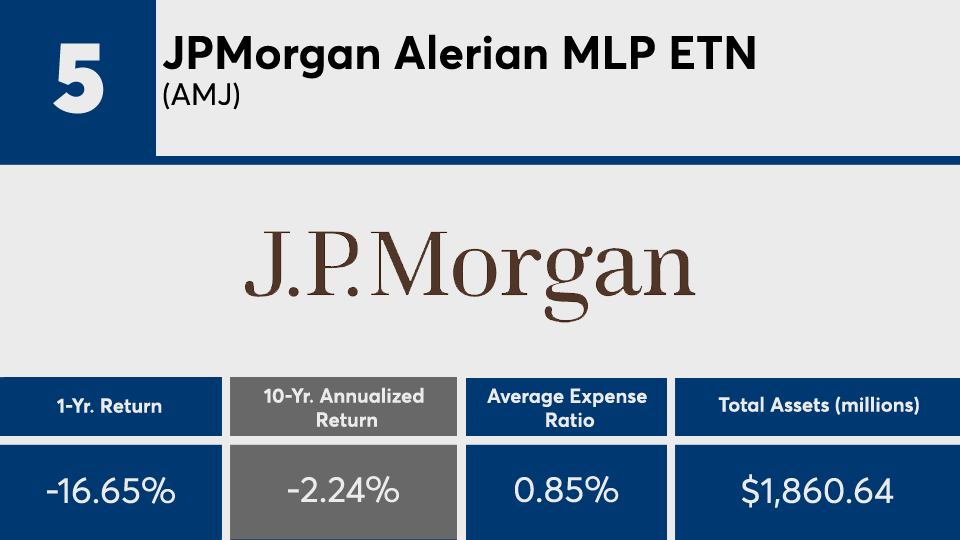
FP021621_5 copy.png

JPMorgan Alerian MLP ETN (AMJ)

YTD Return: 12.38%
3-Yr. Annualized Return: -10.36%
5-Yr. Annualized Return: 0.85%
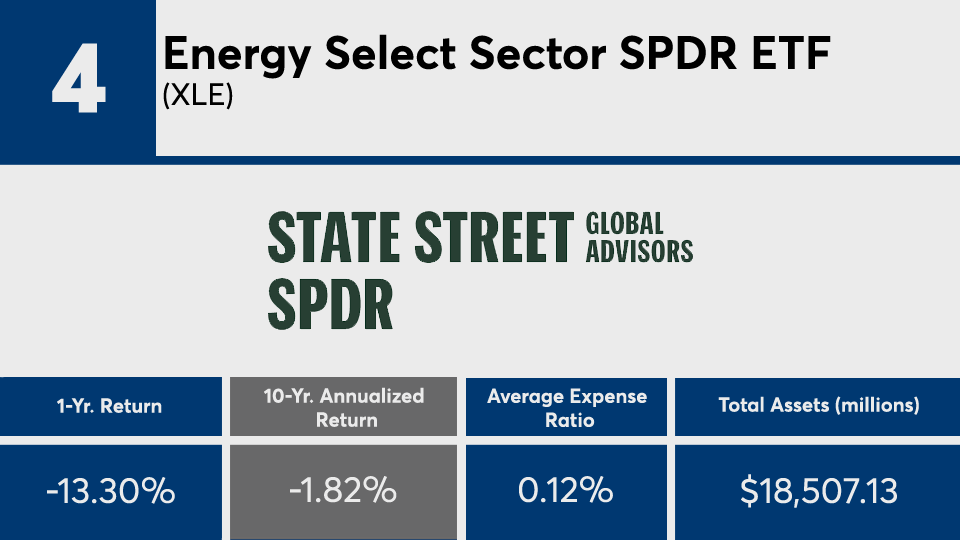
FP021621_4 copy.png

Energy Select Sector SPDR ETF (XLE)

YTD Return: 17.79%
3-Yr. Annualized Return: -8.16%
5-Yr. Annualized Return: 0.11%
FP021621_3 copy.png

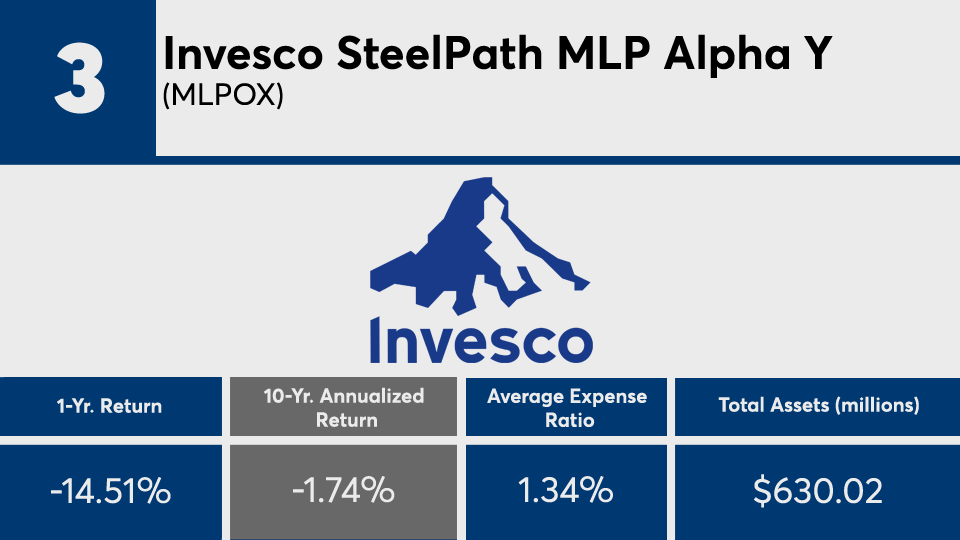
Invesco SteelPath MLP Alpha Y (MLPOX)

YTD Return: 10.82%
3-Yr. Annualized Return: -10.04%
5-Yr. Annualized Return: 3.37%
Minimum Initial Investment: $1,000
FP021621_2 copy.png

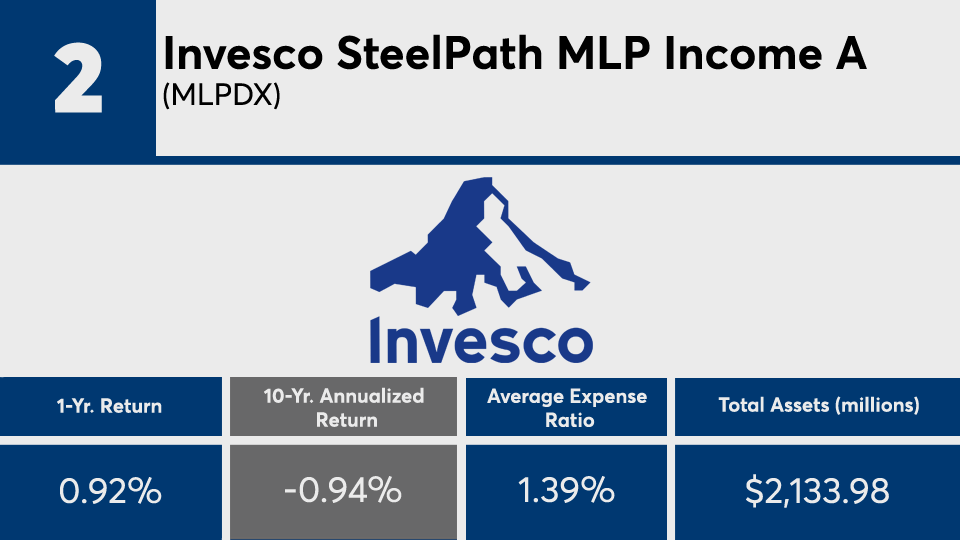
Invesco SteelPath MLP Income A (MLPDX)

YTD Return: 17.87%
3-Yr. Annualized Return: -3.68%
5-Yr. Annualized Return: 8.41%
Minimum Initial Investment: $1,000
Front Load: 5.5%
FP021621_1 copy.png

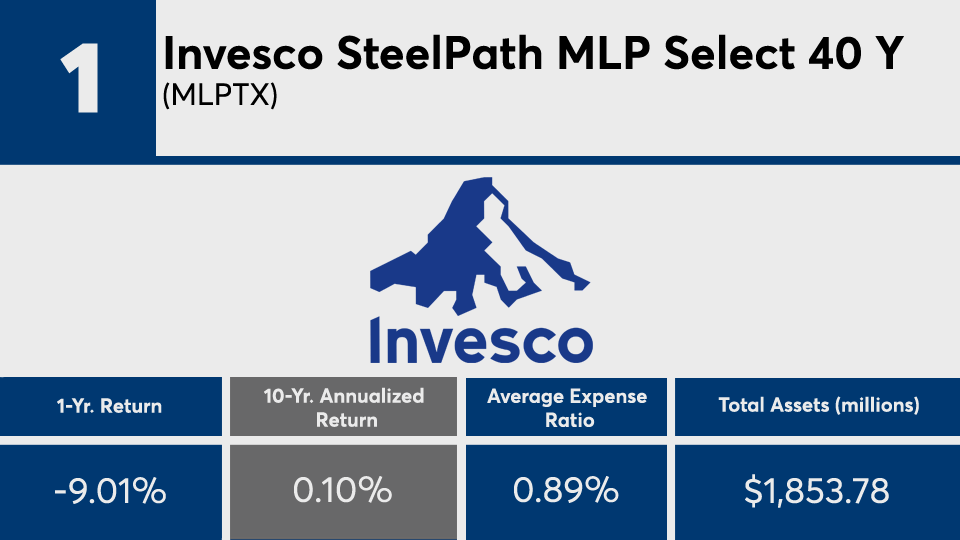
Invesco SteelPath MLP Select 40 Y (MLPTX)

YTD Return: 13.11%
3-Yr. Annualized Return: -6.4%
5-Yr. Annualized Return: 5.12%
Minimum Initial Investment: $1,000
MORE FROM FINANCIAL PLANNING