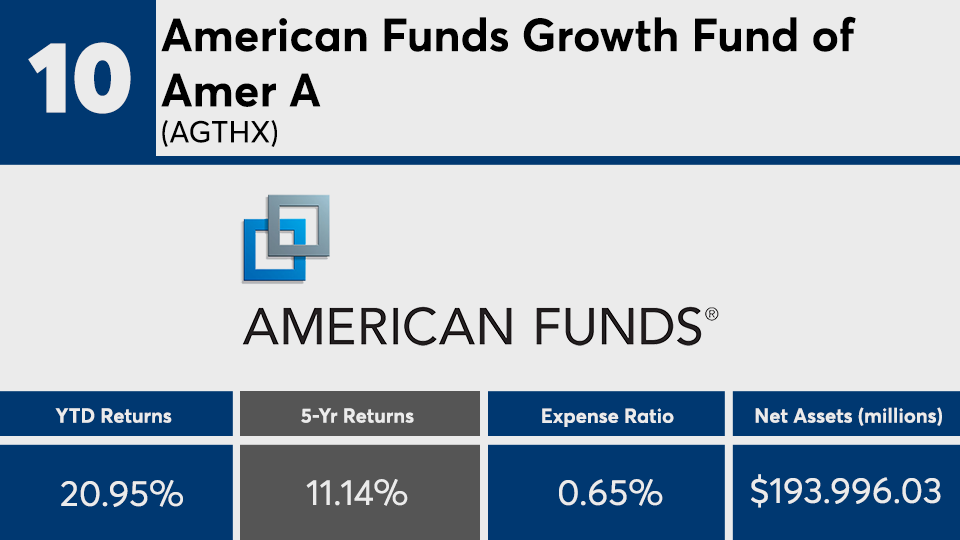
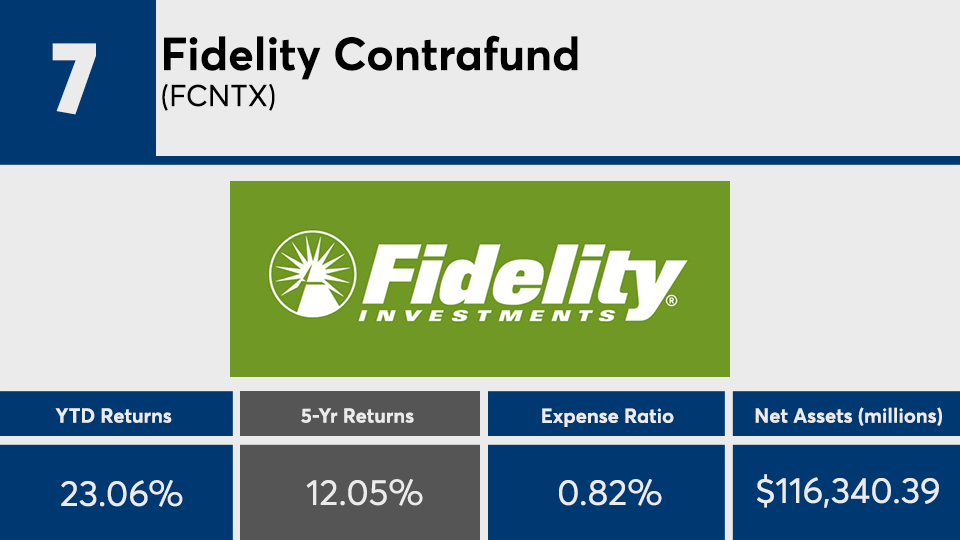
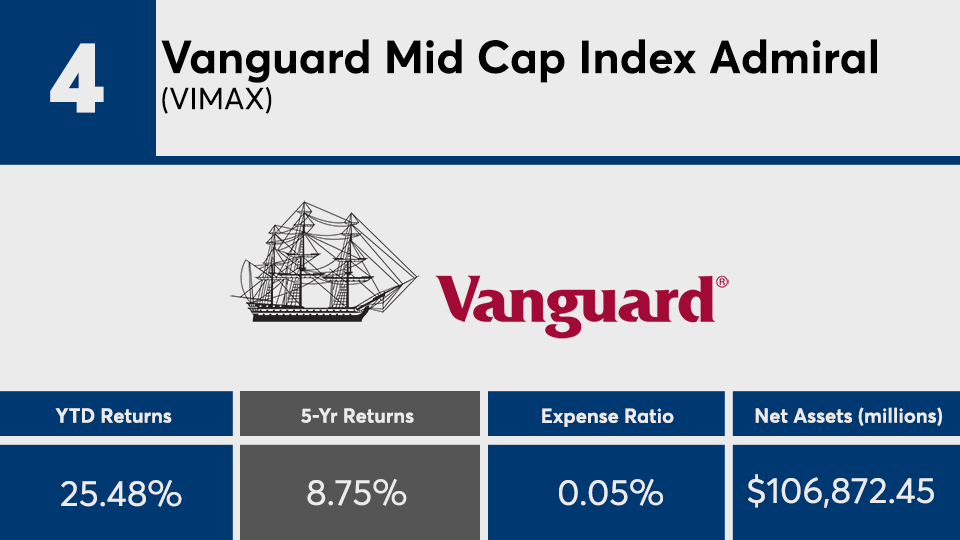
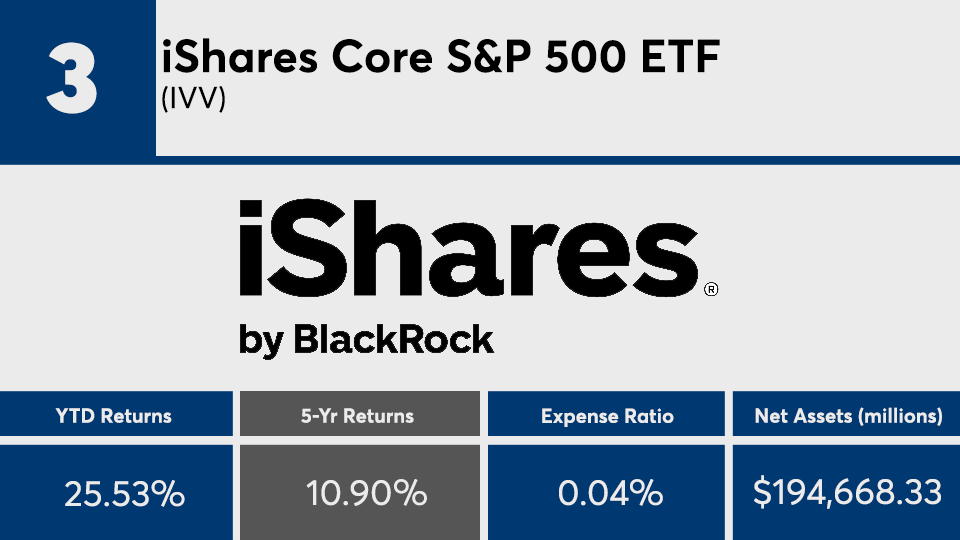
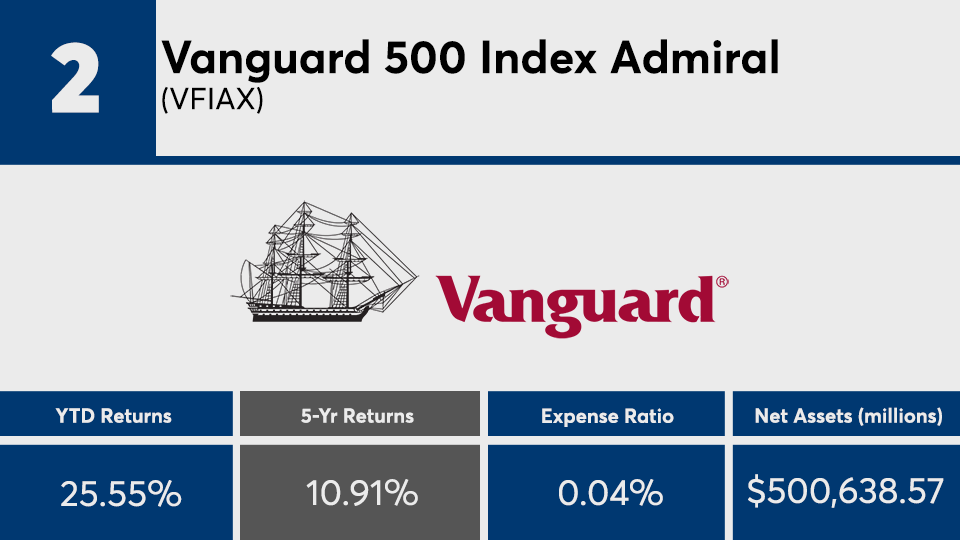
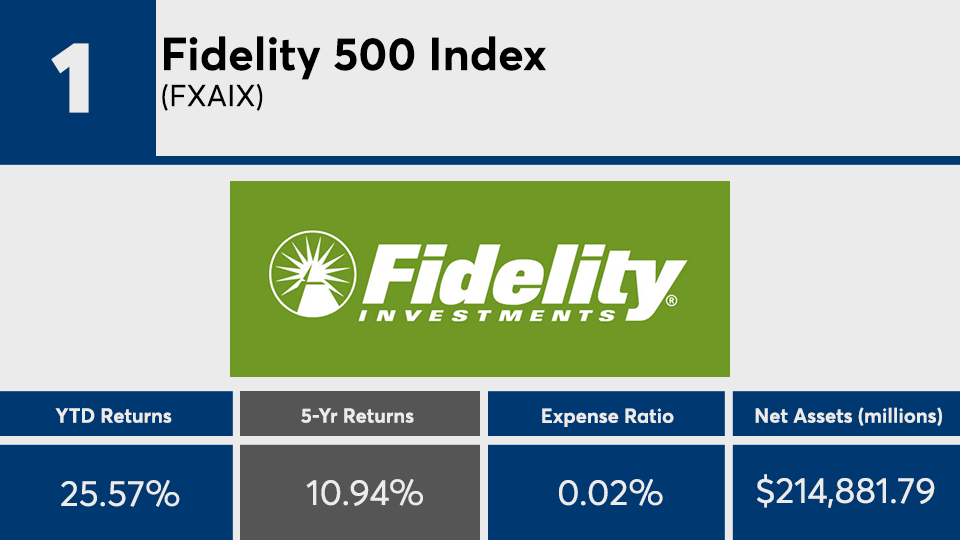
Despite their stellar gains, the industry’s largest funds slightly underperformed the broader markets so far this year.
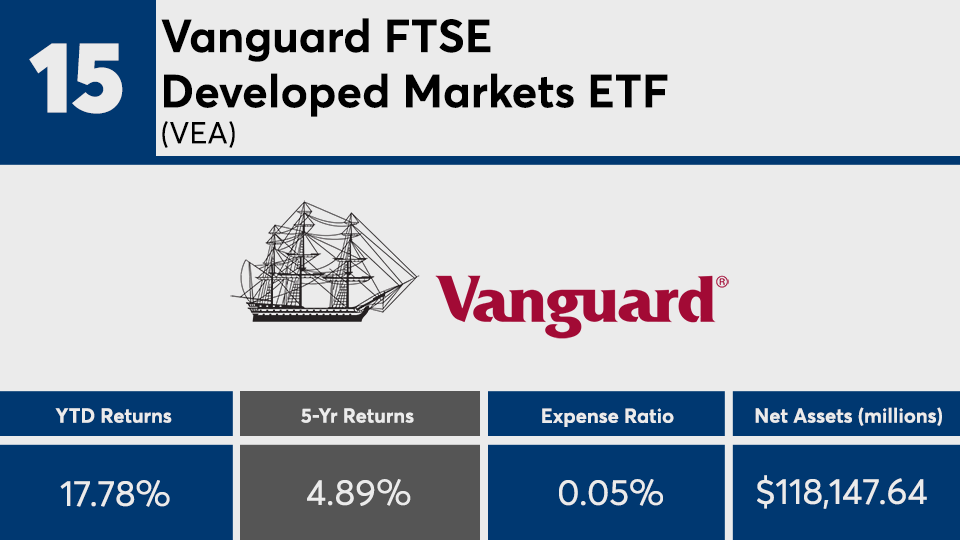
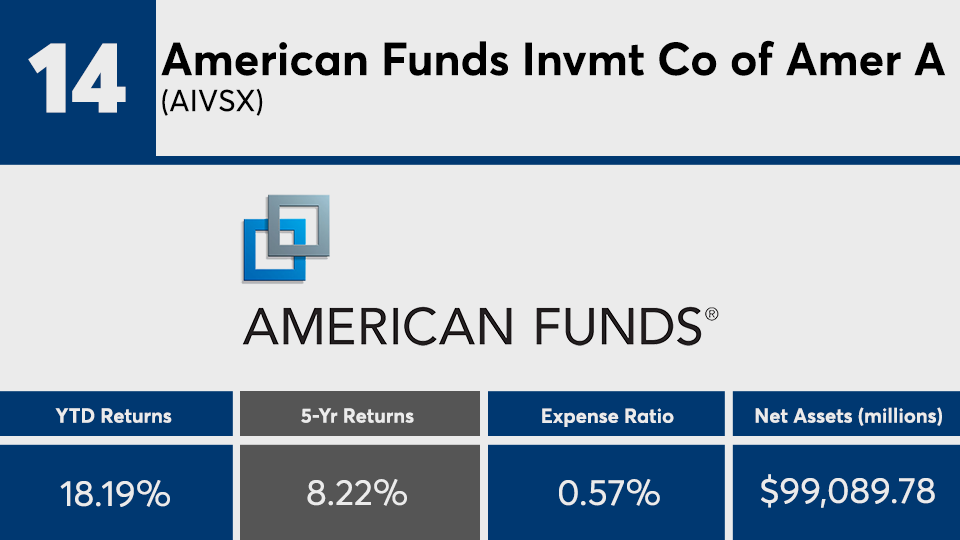
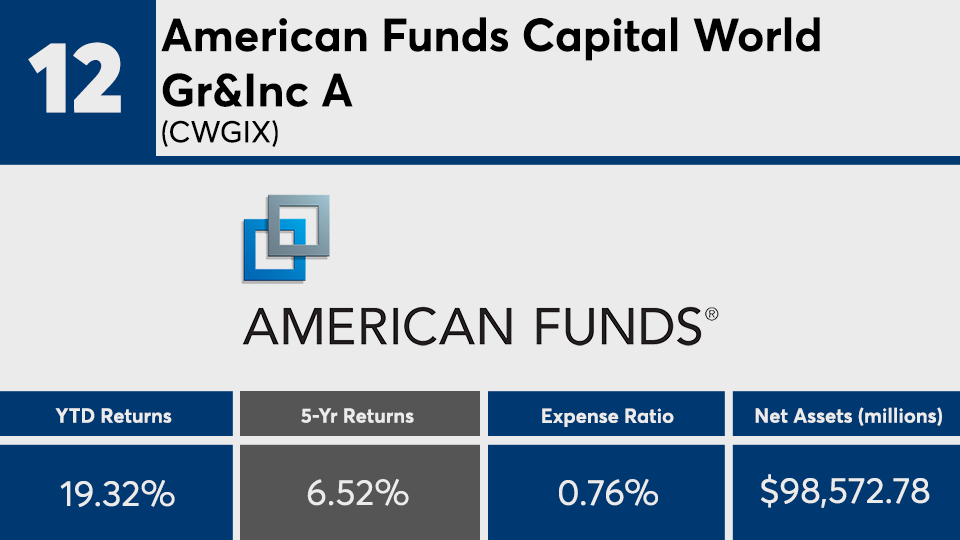
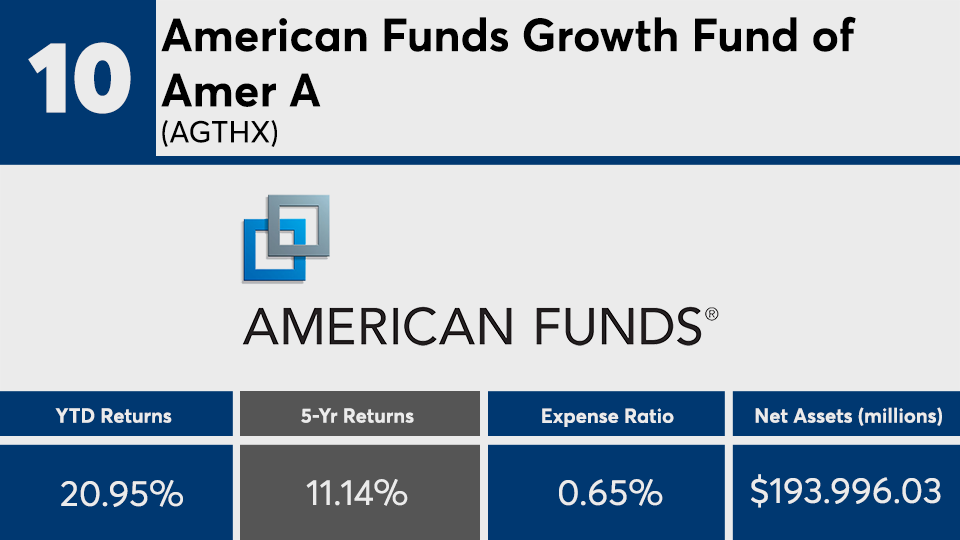
With an average year-to-date return just shy of 20%, gains among the mutual funds and ETFs with the most assets under management are relatively high. Compared with the broader market, however, the returns of these largely active products fell just short of the Dow’s 22.11% gain, as measured by the SPDR Dow Jones Industrial Average ETF (DIA), and the S&P 500’s 26.55% gain, as measured by the SPDR S&P 500 ETF (SPY), over the same period, Morningstar data show. The Barclays Capital U.S. Aggregate Bond Index, as measured by the iShares Core US Aggregate Bond ETF (AGG), reported a YTD gain of 8.35%.
“In most industries, buying the leaders is a sound strategy. The best-selling automobile is well-made, the biggest wireless network is a reliable choice and the top tourist destination is good fun,” John Rekenthaler, Morningstar’s vice president of research, wrote in a recent paper on the performance of the industry’s largest funds. He added that the same logic may also apply to mutual funds, “which, presumably, have earned that status through superior results.”
Pitted against their five-year returns, the last year has been a brighter story for these products, data show. With an average five-year gain of just over 8%, the advances among these funds were generally lower than the Dow’s 12.12% and the S&P 500’s 10.92%, over the same period. The AGG posted a five-year gain of 3.16%.
Fees, as expected, are much lower than the rest of the industry. With an average net expense ratio of 0.34%, these funds were more than 10 basis points cheaper than the 0.48% investors were charged, on average, for fund investing last year, according to Morningstar’s most recent annual fee survey, which reviewed the asset-weighted average expense ratios of all U.S. open-end mutual funds and ETFs.
“Survivorship, of course, comes with size,” Rekenthaler wrote in his analysis of the funds’ long-term performance. “Barring a catastrophe, it takes longer than 10 years to persuade a fund company to fold what once was among the industry's larger funds. To an extent, performance does too, because the big funds almost always have below-average expenses — partially because of economies of scale, and partially because their low costs helped to cause their popularity.”
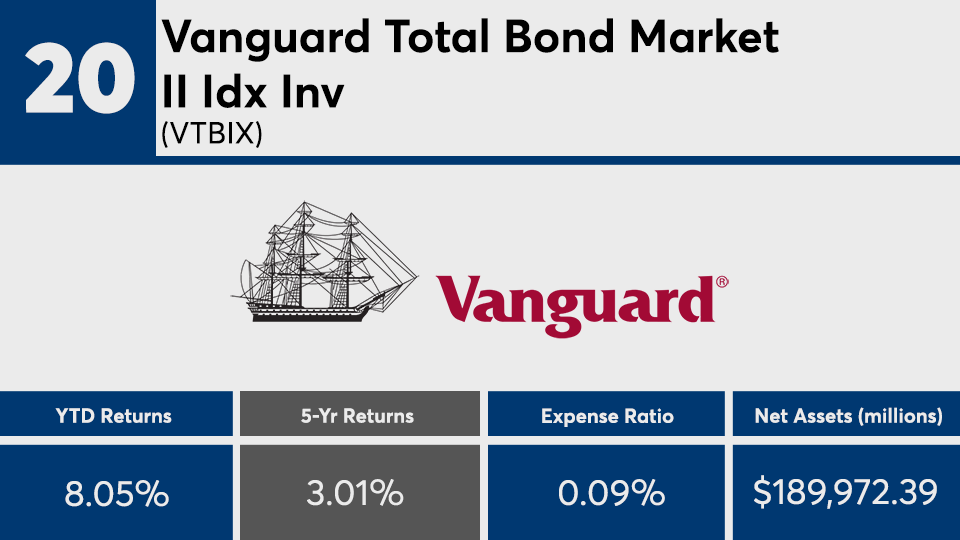
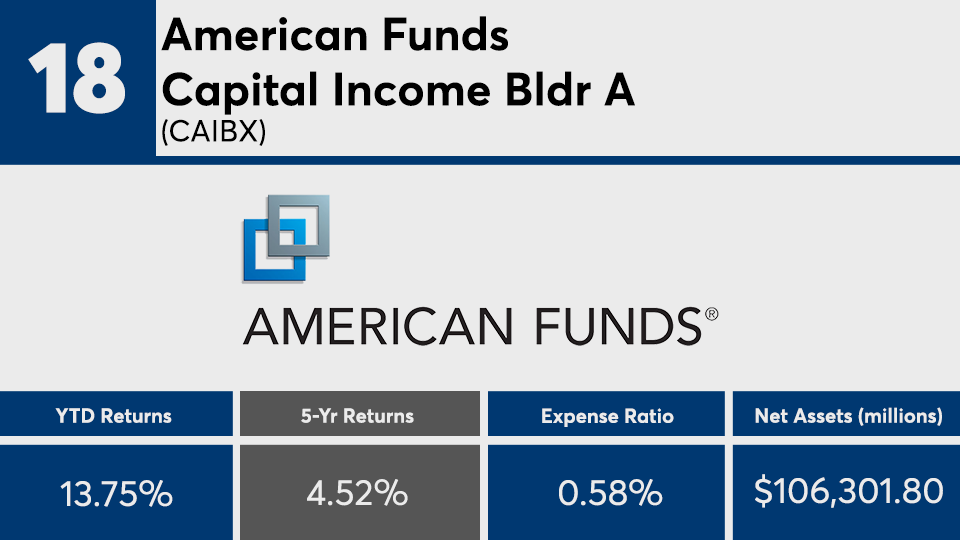
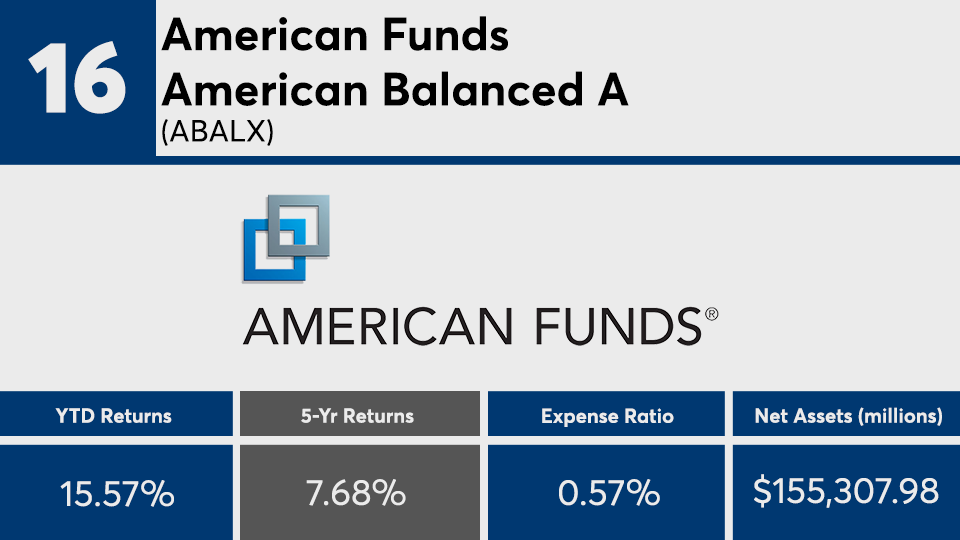
Scroll through to see the 20 largest retail funds ranked by year-to-date returns through Nov. 13. Funds with investment minimums over $100,000 were excluded, as were leveraged and institutional funds. Assets and expense ratios for each, as well as year-to-date returns, are also listed. The data shows each fund's primary share class. All data from Morningstar Direct.
