Asset managers with the biggest long-term losses and some of the industry’s priciest mutual funds outperformed their peers over the past year.
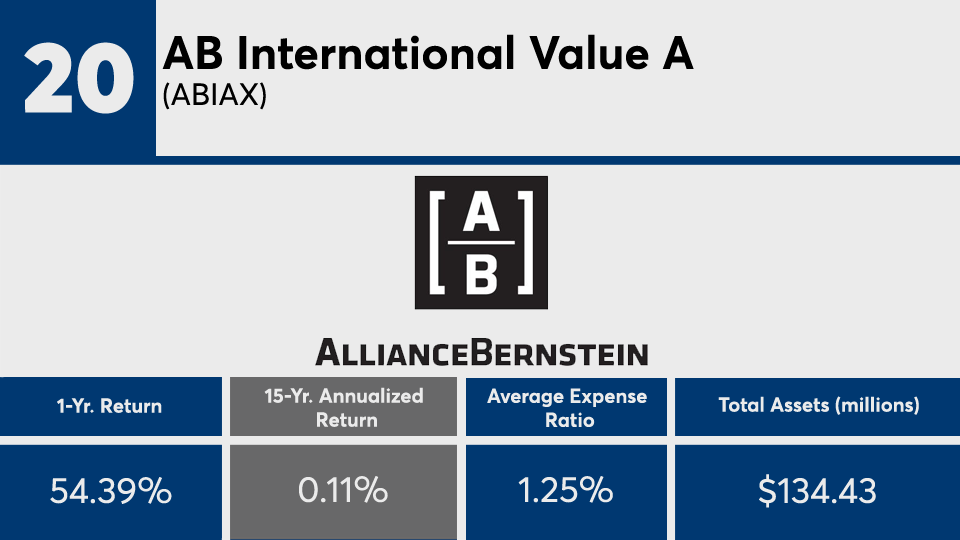
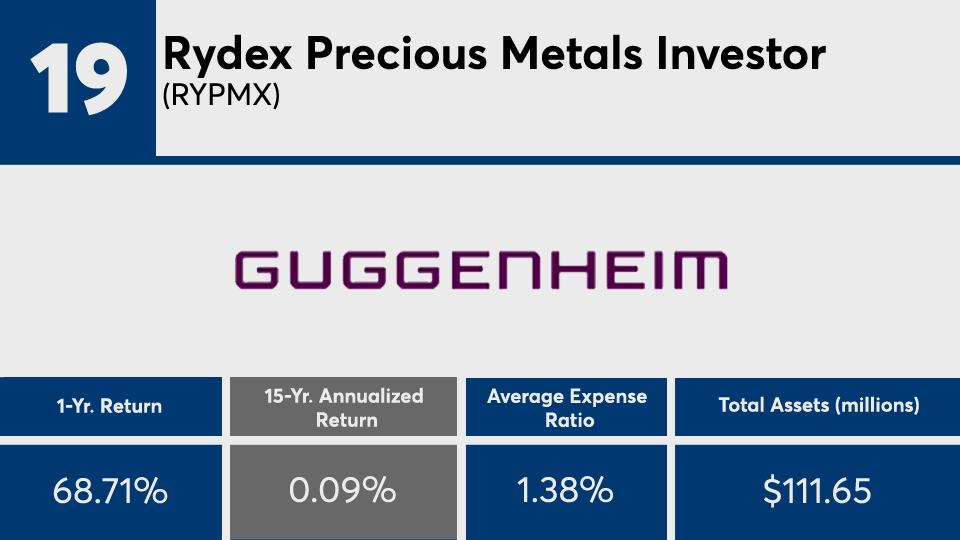
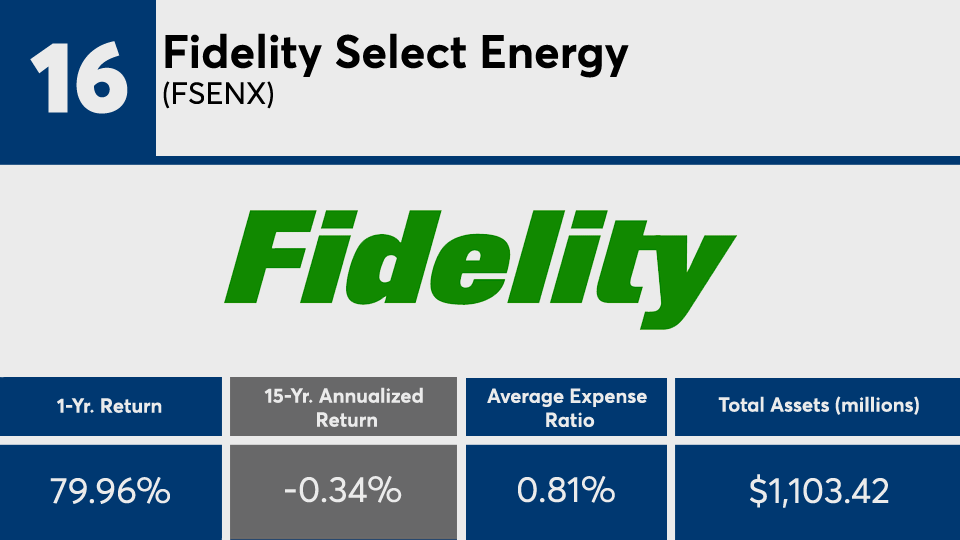
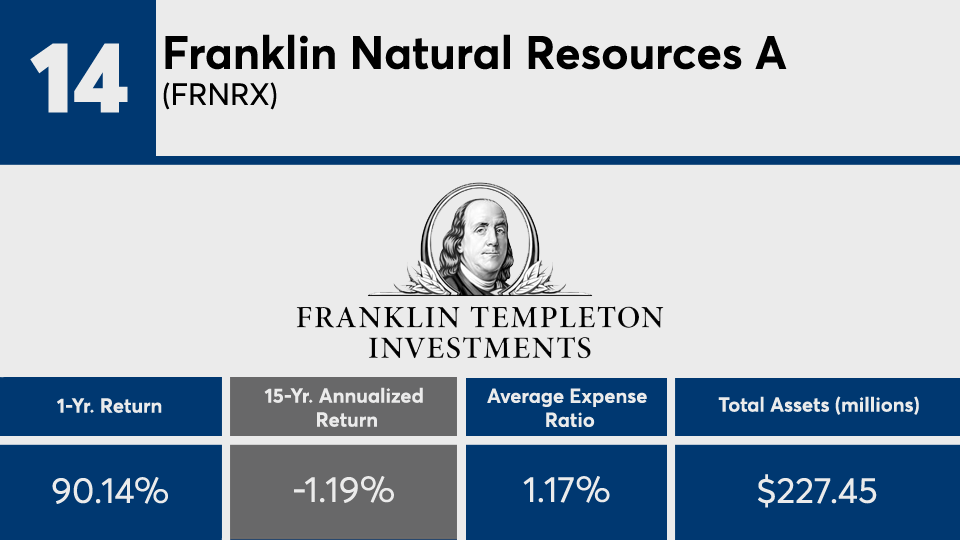
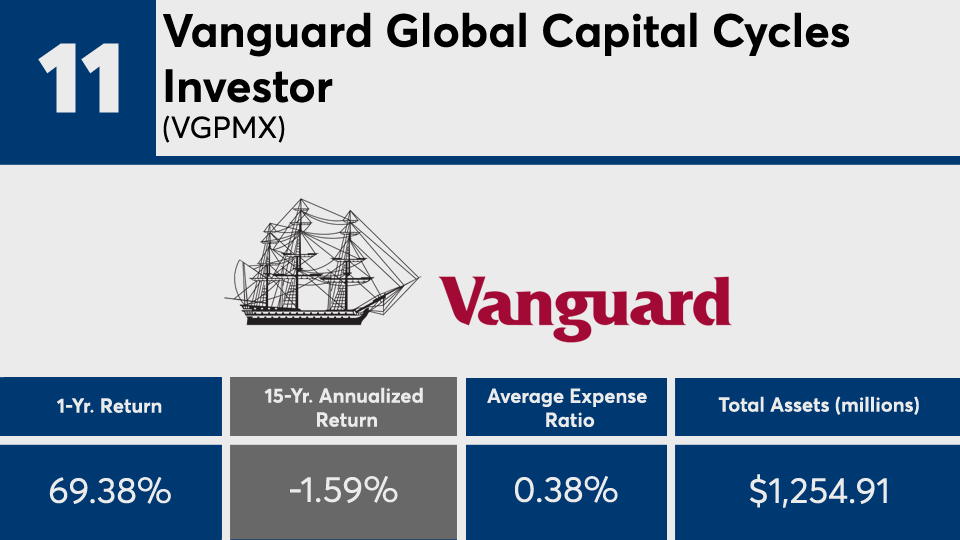
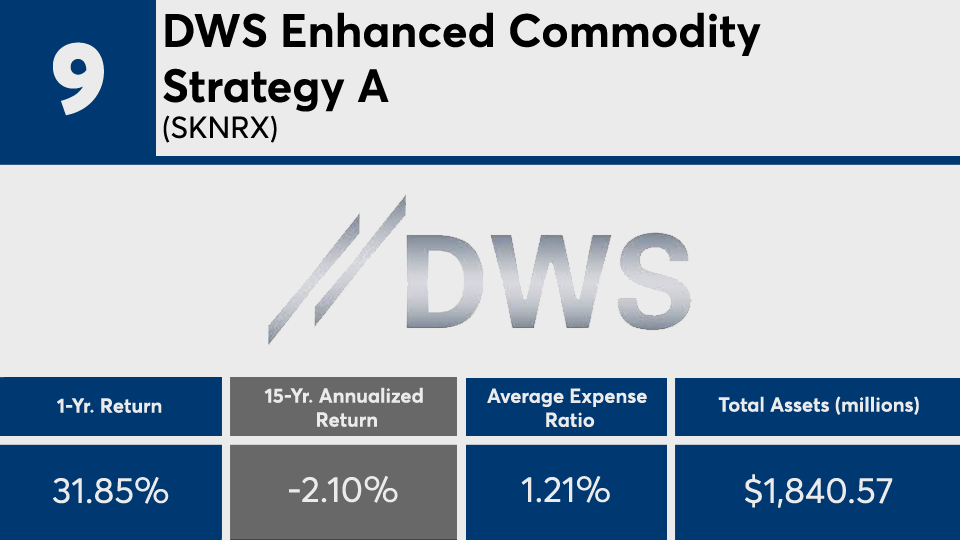
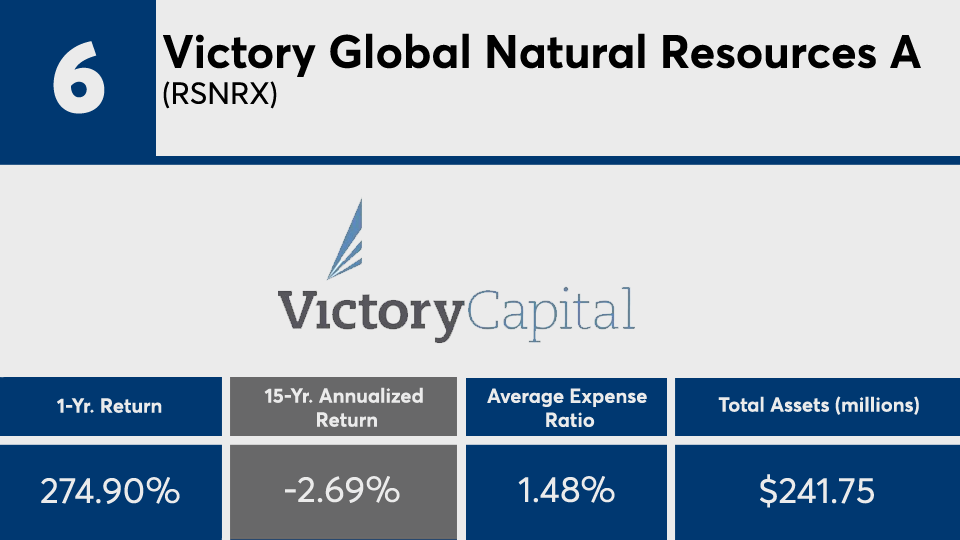
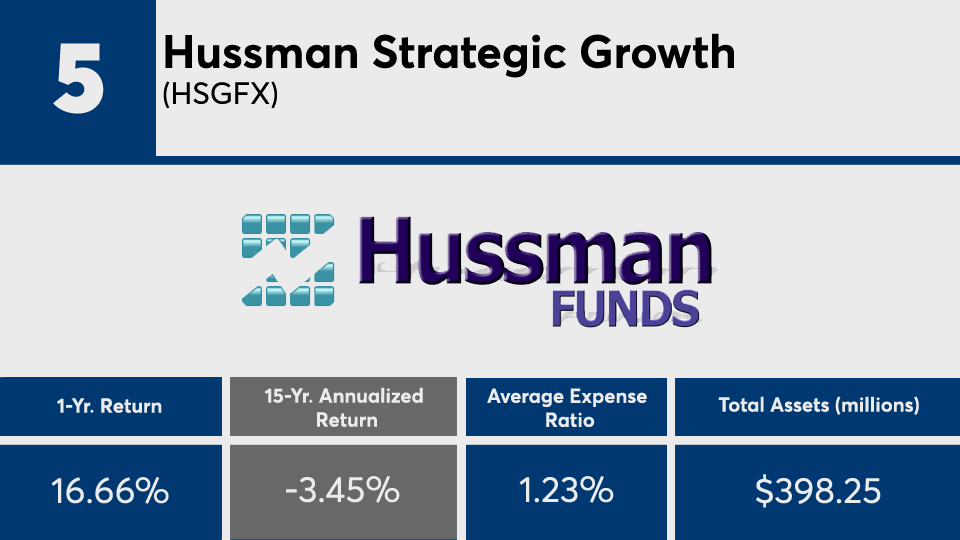
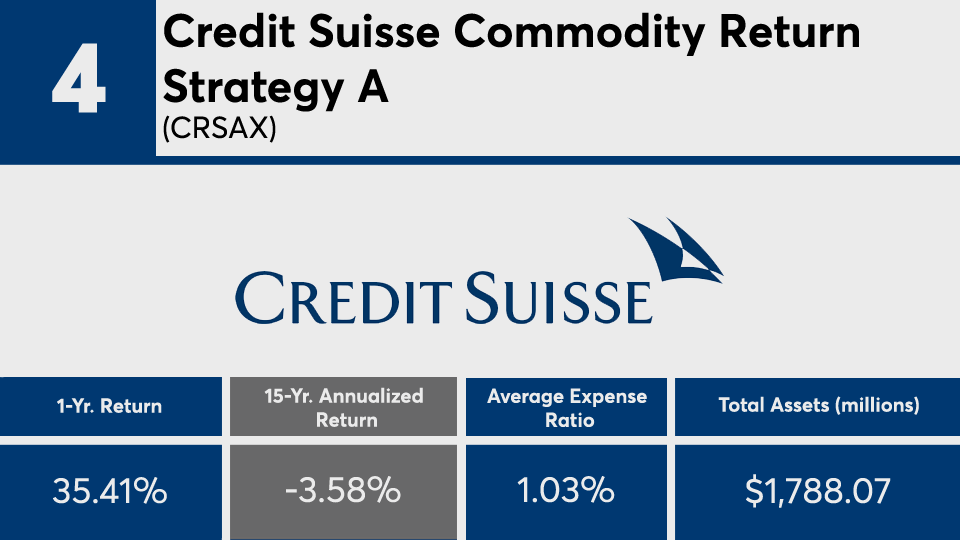
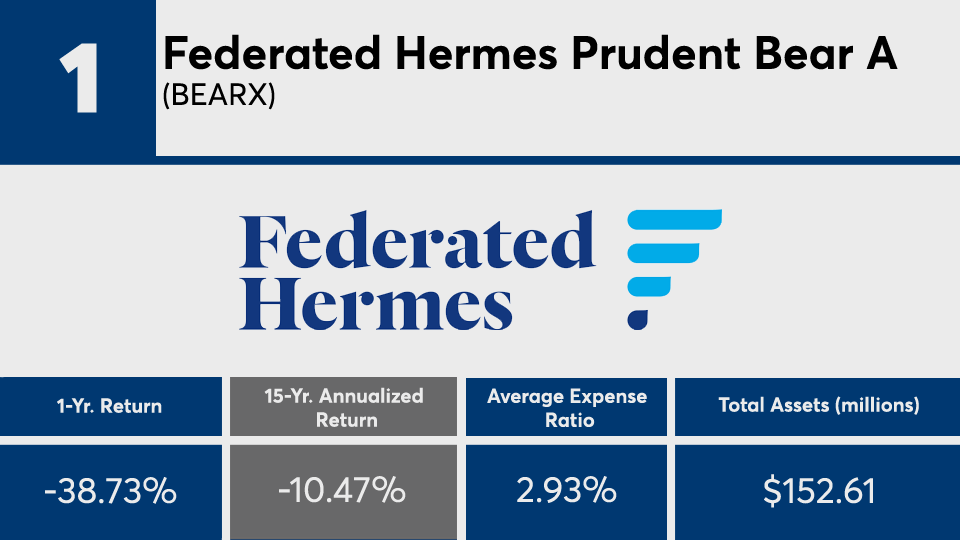
The 20 actively managed funds with the worst 15-year returns, and at least $100 million in assets under management, notched an average loss of 2.37% over the period, Morningstar Direct data show. In the past 12 months, the same lineup outpaced broader markets with an average gain of more than 68%.

With out-of-favor asset classes like energy and natural resources regaining their allure from a valuation perspective, it’s no wonder the strategies have experienced a sharp rebound over the short term, says Amy Magnotta, co-head of discretionary portfolios at Brinker Capital Investments.
“The majority of the worst-performing funds are in the real asset space — targeting energy, natural resources or commodities,” Magnotta says. “The worst-performing fund is, unsurprisingly, a bear market fund, which should not be a long-term holding in a client’s portfolio as, no matter what your short-term view, equity markets should deliver gains given a long-term time horizon.”
Compared with broader markets, index trackers such as the SPDR S&P 500 ETF Trust (
In bonds, the iShares Core U.S. Aggregate Bond ETF (
If fees among the
“Advisors should discuss with their clients the importance of building and maintaining a broadly diversified portfolio that is designed to meet their long-term goals,” Magnotta says, adding that “diversification across and within asset classes will help to mitigate the headwinds of performance of a specific asset class or strategy that is out of favor, allowing clients to weather market volatility and let their time horizon work in their favor.”
Scroll through to see the 20 actively managed funds with more than $100 million in AUM and the worst 15-year returns through April 1. Assets and average expense ratios, as well as year-to-date, one-, three-, five and 10-year returns are also listed for each, as are YTD-, one-, three-, five-, 10- and 15-year net share class flows through April 1. The data show each fund's primary share class. All data is from Morningstar Direct.
