Actively managed funds with the biggest 10-year gains

Funds with human managers calling the shots can still outperform. It’s just a matter of positioning.

That’s been the case for the industry’s 20 top-performing actively managed funds of the past decade. Those with managers making the decisions, and at least $500 million in assets under management, recorded an average 10-year gain of 18%, according to Morningstar Direct. That is well above major stock index trackers. For comparison, the SPDR S&P 500 ETF Trust (SPY) produced a 10-year gain of 11.57%, while the SPDR Dow Jones Industrial Average ETF Tracker (DIA) recorded a gain of 10.68%. On the bonds side, the iShares Core US Aggregate Bond ETF (AGG) notched a gain of 3.80%, data show.

“Being in the right companies, as well as the right industries, are what’s important,” says Marc Pfeffer, CIO of CLS Investments, noting that active Fidelity funds made up for most of the top performers of the past 10 years. “When you look at this list, they’re dominated by tech or by some form of health care — whether it’s biotech, sciences funds or just broad health-care category funds.”

As with many of their actively managed peers, these funds come with a hefty price tag. With an average net expense ratio of 0.83%, they are nearly twice the broader industry’s average of 0.48%, according to Morningstar’s most recent annual fee survey, which reviewed the asset-weighted average expense ratios of all U.S. open-end mutual funds and ETFs.

Fees, as well as gains, came in well above the industry’s biggest funds. The largest overall fund, the Vanguard Total Stock Market Index Admiral Shares (VTSAX), has $822.4 billion in AUM and carried a 0.04% expense ratio, data show. The Vanguard fund notched a 10-year gain of 11.46. On the bonds side, the $264.2 billion Vanguard Total Bond Market Index Fund (VBTLX), had a 0.05% expense ratio and notched a 10-year gain of 3.95%.

In the age of coronavirus-driven market volatility, data also show why manager selection is key. With just three of the decade’s top-performers reporting losses so far this year, Pfeffer says it’s no surprise these long-term winners managed an average YTD gain of more than 5%.

“Just because someone’s charging 1% doesn’t mean you should take them off your list. There are many cases where the managers deserve to get paid because they’re doing a good job for you,” Pfeffer says. “It’s like going to a nice restaurant; you don’t mind paying for expensive food when the meal is good.”

Scroll through to see the 20 actively managed funds with the biggest 10-year gains through May 12. Funds with less than $500 million in AUM and investment minimums over $100,000 were excluded, as were leveraged and institutional funds. Assets and expense ratios, as well as year-to-date and one-, three-, five- and 10-year returns are listed for each. The data show each fund's primary share class. All data is from Morningstar Direct.

FP051320_20 copy.png

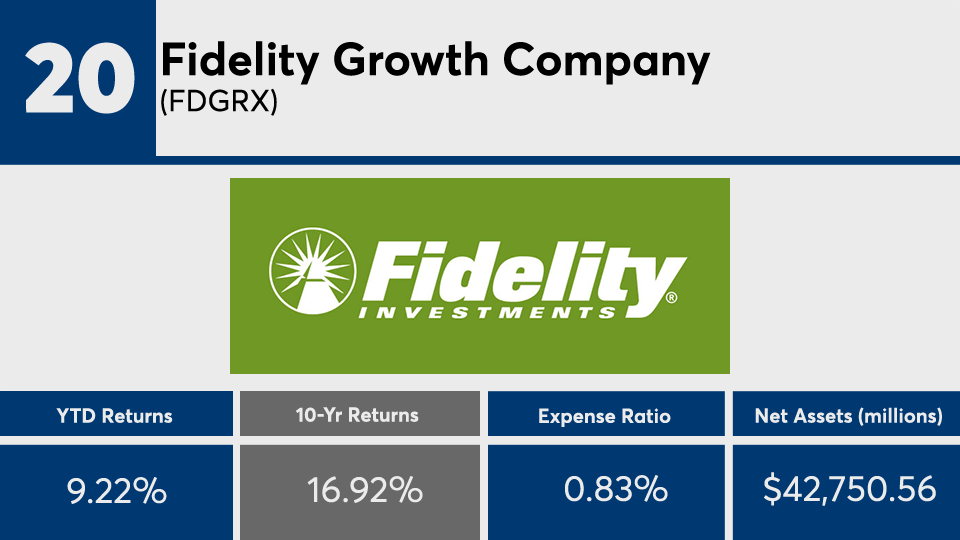
Fidelity Growth Company (FDGRX)

1-Yr. Return: 25.17%
3-Yr. Annualized Return: 19.31%
5-Yr. Annualized Return: 16.24%
FP051320_19 copy.png

Fidelity Advisor Technology A (FADTX)

1-Yr. Return: 28.19%
3-Yr. Annualized Return: 19.91%
5-Yr. Annualized Return: 19.63%
Load: 5.75%
FP051320_18 copy.png

Fidelity Select Medical Technology and Devices (FSMEX)

1-Yr. Return: 19.99%
3-Yr. Annualized Return: 18.11%
5-Yr. Annualized Return: 15.78%
FP051320_17 copy.png

Janus Henderson Global Technology and Innovation D (JNGTX)

1-Yr. Return: 19.79%
3-Yr. Annualized Return: 21.64%
5-Yr. Annualized Return: 20.06%
FP051320_16 copy.png

Fidelity Select Semiconductors (FSELX)

1-Yr. Return: 15.60%
3-Yr. Annualized Return: 17.00%
5-Yr. Annualized Return: 18.23%
FP051320_15 copy.png

Fidelity Select Technology (FSPTX)

1-Yr. Return: 28.25%
3-Yr. Annualized Return: 19.66%
5-Yr. Annualized Return: 19.62%
FP051320_14 copy.png

T. Rowe Price Communications & Technology Investor (PRMTX)

1-Yr. Return: 16.73%
3-Yr. Annualized Return: 17.18%
5-Yr. Annualized Return: 16.88%
FP051320_13 copy.png

Fidelity Advisor Health Care I (FHCIX)

1-Yr. Return: 27.30%
3-Yr. Annualized Return: 16.13%
5-Yr. Annualized Return: 8.75%
FP051320_12 copy.png

Fidelity Select IT Services (FBSOX)

1-Yr. Return: 7.99%
3-Yr. Annualized Return: 20.07%
5-Yr. Annualized Return: 15.82%
FP051320_11 copy.png

Fidelity Advisor Growth Opportunities I (FAGCX)

1-Yr. Return: 19.98%
3-Yr. Annualized Return: 24.90%
5-Yr. Annualized Return: 18.09%
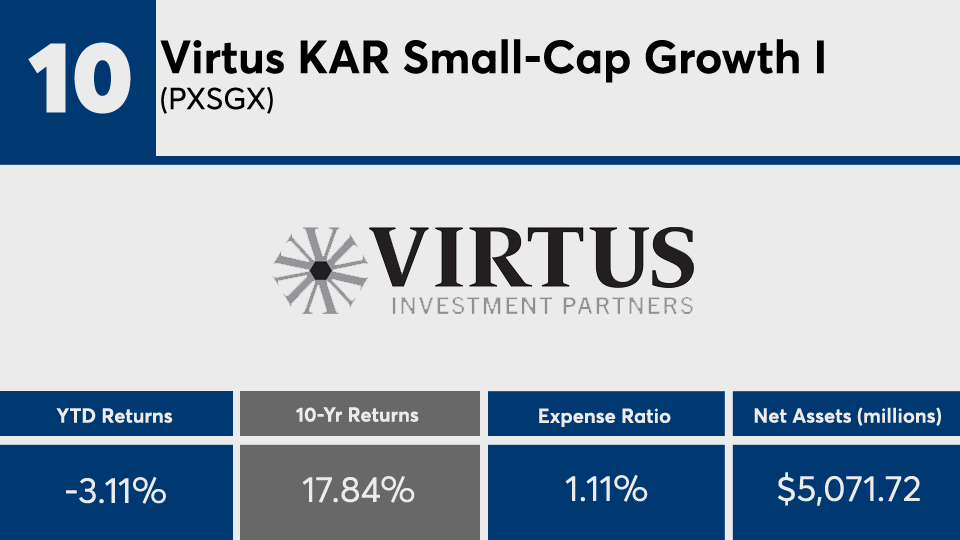
FP051320_10 copy.png

Virtus KAR Small-Cap Growth I (PXSGX)

1-Yr. Return: 3.43%
3-Yr. Annualized Return: 21.94%
5-Yr. Annualized Return: 20.43%
FP051320_9 copy.png

Fidelity Select Health Care (FSPHX)

1-Yr. Return: 30.63%
3-Yr. Annualized Return: 17.15%
5-Yr. Annualized Return: 9.31%
FP051320_8 copy.png

T. Rowe Price New Horizons (PRNHX)

1-Yr. Return: 18.45%
3-Yr. Annualized Return: 20.68%
5-Yr. Annualized Return: 16.42%
FP051320_7 copy.png

Fidelity Advisor Biotechnology I (FBTIX)

1-Yr. Return: 26.83%
3-Yr. Annualized Return: 13.96%
5-Yr. Annualized Return: 4.17%
FP051320_6 copy.png

VALIC Company I Health Sciences (VCHSX)

1-Yr. Return: 19.65%
3-Yr. Annualized Return: 14.46%
5-Yr. Annualized Return: 8.29%
FP051320_5 copy.png

Fidelity Select Biotechnology (FBIOX)

1-Yr. Return: 28.57%
3-Yr. Annualized Return: 13.55%
5-Yr. Annualized Return: 4.19%
FP051320_4 copy.png

T. Rowe Price Health Sciences (PRHSX)

1-Yr. Return: 19.93%
3-Yr. Annualized Return: 14.71%
5-Yr. Annualized Return: 8.52%
FP051320_3 copy.png

Morgan Stanley Insight A (CPOAX)

1-Yr. Return: 34.50%
3-Yr. Annualized Return: 32.09%
5-Yr. Annualized Return: 23.02%
Load: 5.25%
FP051320_2 copy.png

T. Rowe Price Global Technology (PRGTX)

1-Yr. Return: 16.86%
3-Yr. Annualized Return: 15.41%
5-Yr. Annualized Return: 18.16%
FP051320_1 copy.png

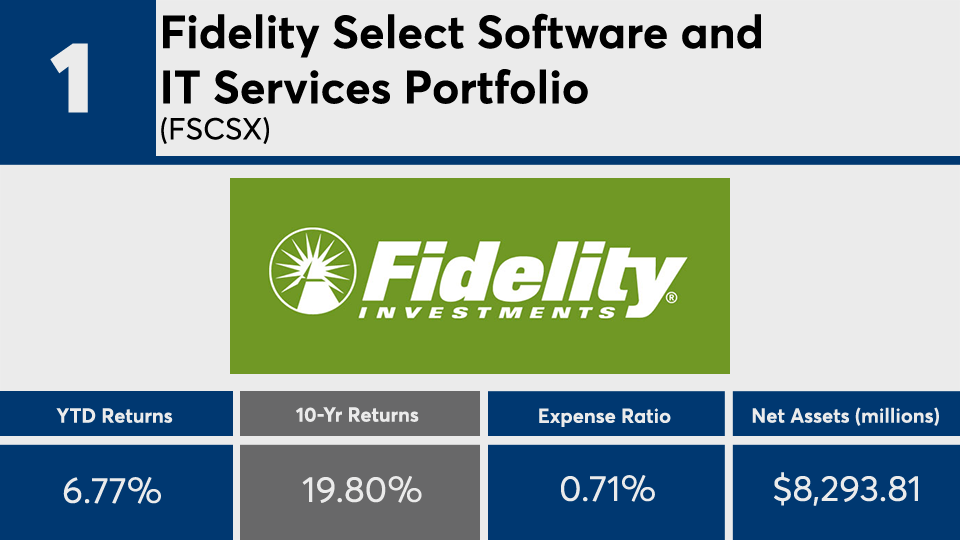
Fidelity Select Software and IT Services Portfolio (FSCSX)

1-Yr. Return: 21.26%
3-Yr. Annualized Return: 22.00%
5-Yr. Annualized Return: 20.58%
MORE FROM FINANCIAL PLANNING