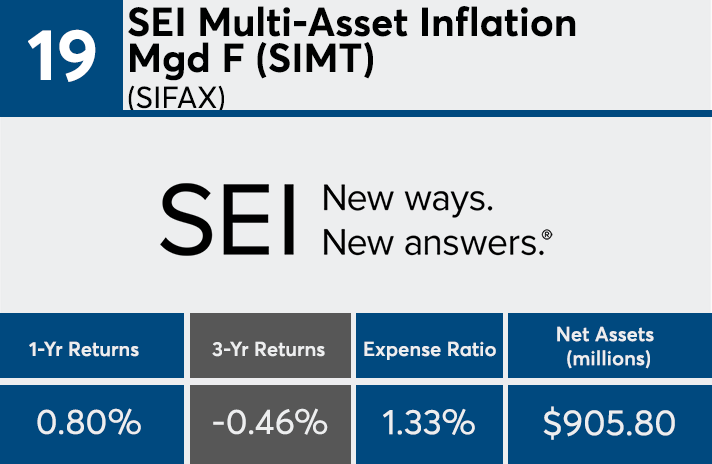
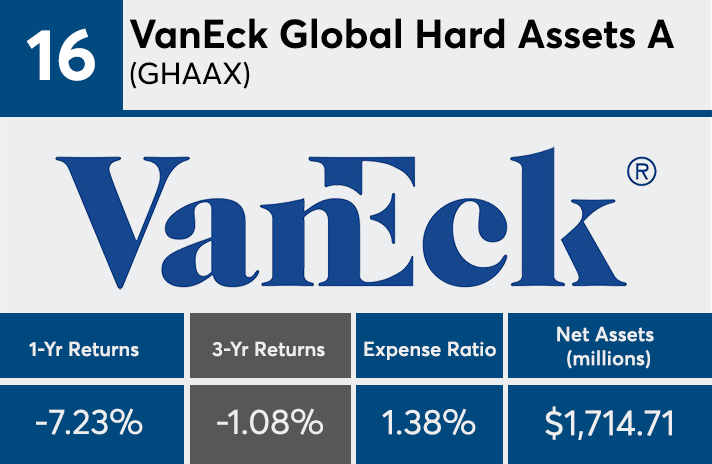
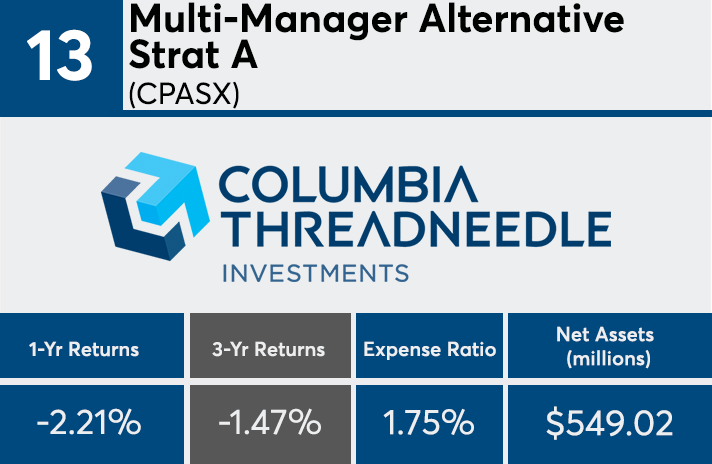
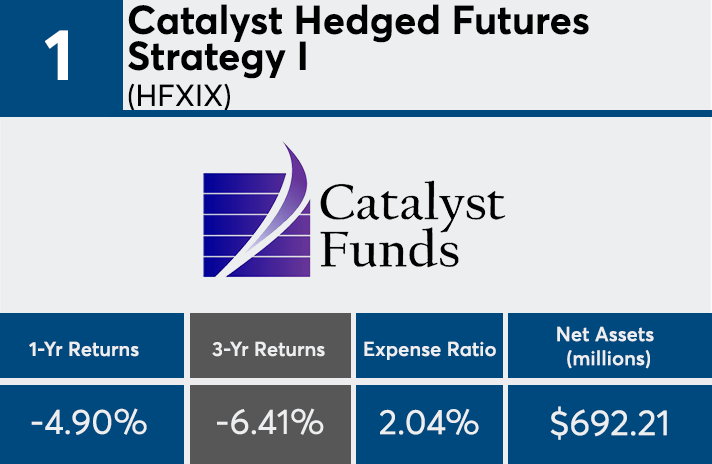
The industry’s 20 worst-performing actively managed mutual funds over the last three years are home to a combined $25.8 billion in client assets. With fees averaging just over 140 basis points, their poor performance numbers came on top of a significant expense to clients.
The cost of these returns were more than 40 basis points higher than
“Costs are one of the most reliable predictors of long-term returns,” says Dan Culloton, Morningstar’s director of manager research and equity strategies. “It gives them a higher hurdle to overcome. When your strategy, category or asset class is out of favor, it hurts even more to invest because not only are you down, but you’re also surrendering your high cost to the asset manager.”
Managed futures, energy limited partnerships and multi-alternative offerings were among some of the most common Morningstar categories found in this screen of funds.
“Funds like the Eagle MLP strategy, Oppenheimer’s SteelPath MLP strategy, Ivy Energy or Invesco Energy are all just in a really tough spot,” Culloton says. “Those have been the worst-ranking categories among sector funds.”
Culloton also noted that international offerings were also among the worst-performing. A case in point: two European stock funds and one foreign blend fund, with a combined $5.6 billion in assets, found their way on the list. Over the three-year period, “the only thing worse than the Europe stock category [internationally] is China, which is quite a bit worse,” he says, adding that the European stock category “has been one of the poorer-performing categories over the past one- to- three years. These are down 10%, annualized, over the past year.”
Lower costs is “one of the primary reasons why ETFs are so popular. When we see actively managed funds, particularly actively managed equity, the last few years have been suffering outflows. When you break that down by cost, the higher cost is worse than the lower-cost funds.”
Scroll through to see all 20 actively managed funds with the worst three-year returns. Leveraged and institutional funds were excluded, as were those with investment minimums above $100,000. One-year returns, assets and expense ratios are also shown. All data from Morningstar Direct.


