Top-performing 2025 target-date funds lag broader indexes

Target-date funds for the next generation of retirees have underperformed broader indexes over the last five years. They have also recorded significant outflows.

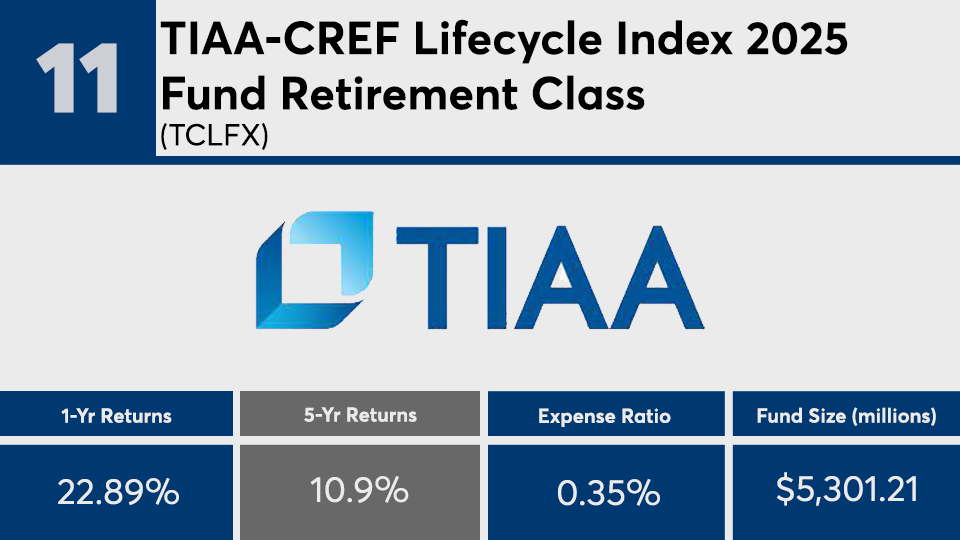
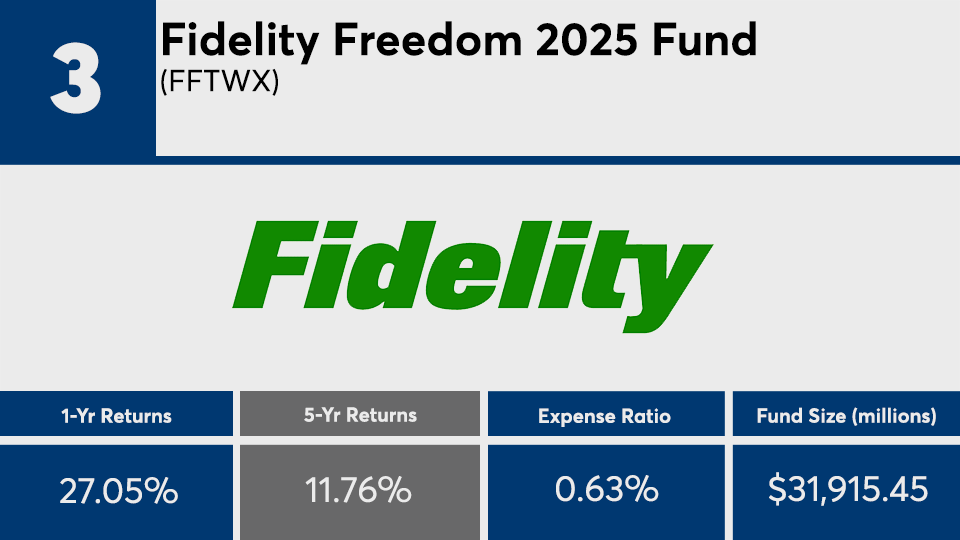
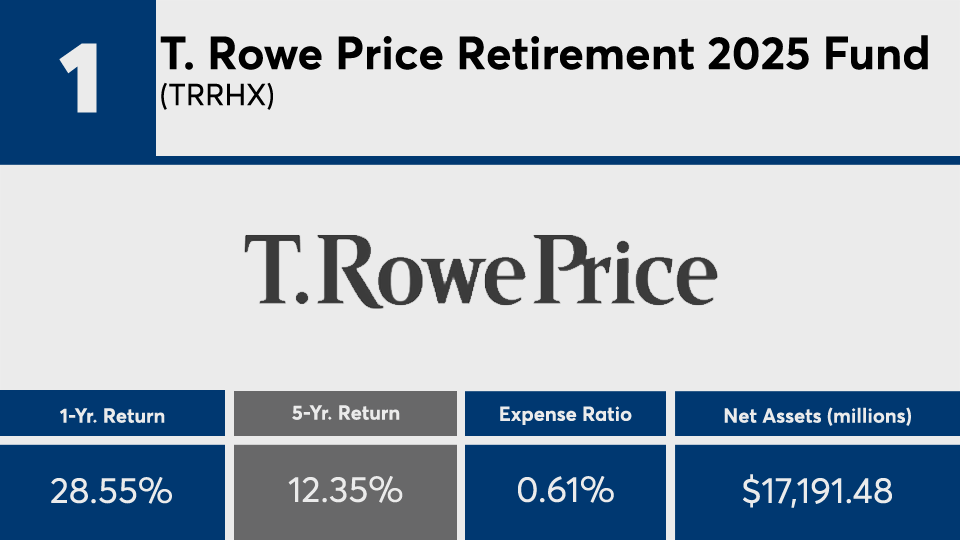
The top-performing 2025 target-date funds, with at least $100 million in assets under management, notched an average five-year gain of roughly 11%, Morningstar Direct data show. Over the past year, the same funds also lagged with an average gain of less than 25%.

For comparison, broader index funds such as the SPDR S&P 500 ETF Trust (SPY) and the SPDR Dow Jones Industrial Average ETF (DIA) had five-year gains of 18.12% and 17.15%, respectively. Over the past year, the funds had returns of 42.3% and 37.7%.

In bonds, the iShares Core U.S. Aggregate Bond ETF (AGG), meanwhile, had a one-year loss of 0.55% and a five-year gain of 3%.

In addition to their overall underperformance, Morningstar strategist Jason Kephart says the industry has also experienced outflows as a result of the coronavirus pandemic.

“As the economy has rebounded this year, the flows have come back a lot,” Kephart says. “That was definitely a temporary thing. We did see contributions to target-date funds really crater in 2020.”

To be sure, target-date funds with the biggest gains recorded net outflows of more than $2.4 billion over the past five years and more than $9 billion over the past year, data show.

“The big trend we continue to see is that fees are really driving a lot of that selection,” Kephart says. “We saw the number of excessive-fee lawsuits was pretty high last year. It was up like five times for 2019. When it comes to target-date funds and plan sponsors ... they are just very, very fee sensitive.”

The average expense ratio among these leaders was around 52 basis points. That is only slightly higher than the 0.45% investors paid on average for fund investing in 2019, according to Morningstar’s most recent fee survey.

When it comes to target-date funds and long-term performance, advisors should emphasize with clients the role sector funds can play in a diversified portfolio, Kephart says.

“The big, main thing would be the focus on the portfolio as a whole, and how things all fit together,” he says. “That's kind of the key.”

Scroll through to see the 20 target date funds for 2025 with the biggest five-year returns, and at least $100 million in AUM, through June 25, 2021. Net expense ratios, loads, investment minimums and manager names, as well as YTD, one-, three-, five- and 15-year returns and month-end share class flows are also listed. The data show each fund's primary share class. Leveraged, institutional and funds with investment minimums over $100,000 have been excluded. All data is from Morningstar Direct.

FP070221_20 copy.png
YTD Return: 6.37%; 3-Yr. Annualized Return: 10.89%; 10-Yr. Annualized Return: N/A; 15-Yr. Annualized Return: N/A; YTD Net Flow: (millions): $1.8; 1-Yr. Net Flow (millions): $2.12; 3-Yr. Net Flow (millions): $2.89; 5-Yr. Net Flow (millions): $7.56; 10-Yr. Net Flow (millions): N/A; 15-Yr. Net Flow (millions): N/A; Minimum Initial Investment: 1,000.00; Front load: 5.50%; Inception Date: Dec. 31, 2014; Manager Names: Brendon Shvetz; Graham A. Rennison; Erin Browne.
FP070221_19 copy.png
YTD Return: 6.57%; 3-Yr. Annualized Return: 9.77%; 10-Yr. Annualized Return: 8.65%; 15-Yr. Annualized Return: N/A; YTD Net Flow: (millions): ($20.65); 1-Yr. Net Flow (millions): ($32.46); 3-Yr. Net Flow (millions): ($72.71); 5-Yr. Net Flow (millions): ($44.67); 10-Yr. Net Flow (millions): $228.2; 15-Yr. Net Flow (millions): N/A; Inception Date: March 12, 2008; Manager Names: Zifan Tang; Patrick Kwok.
FP070221_18 copy.png
YTD Return: 6.11%; 3-Yr. Annualized Return: 10.12%; 10-Yr. Annualized Return: 7.59%; 15-Yr. Annualized Return: N/A; YTD Net Flow: (millions): ($1.34); 1-Yr. Net Flow (millions): ($0.32); 3-Yr. Net Flow (millions): ($14.15); 5-Yr. Net Flow (millions): ($18.65); 10-Yr. Net Flow (millions): $1.77; 15-Yr. Net Flow (millions): N/A; Minimum Initial Investment: 1,000.00; Front load: 5.25%; Inception Date: June 30, 2010; Manager Names: Philip J. Green; Chris Chung.
FP070221_17 copy.png
YTD Return: 7.33%; 3-Yr. Annualized Return: 10.61%; 10-Yr. Annualized Return: N/A; 15-Yr. Annualized Return: N/A; YTD Net Flow: (millions): $2.98; 1-Yr. Net Flow (millions): $2.42; 3-Yr. Net Flow (millions): $24.78; 5-Yr. Net Flow (millions): $81.02; 10-Yr. Net Flow (millions): N/A; 15-Yr. Net Flow (millions): N/A; Minimum Initial Investment: 2,500.00; Inception Date: Aug. 20, 2013; Manager Names: Wyatt A. Lee; Kimberly E. DeDominicis; Andrew Jacobs van Merlen.
FP070221_16 copy.png
YTD Return: 6.64%; 3-Yr. Annualized Return: 9.6%; 10-Yr. Annualized Return: 8%; 15-Yr. Annualized Return: N/A; YTD Net Flow: (millions): ($6.35); 1-Yr. Net Flow (millions): $4.02; 3-Yr. Net Flow (millions): $28.44; 5-Yr. Net Flow (millions): $19.58; 10-Yr. Net Flow (millions): $52.86; 15-Yr. Net Flow (millions): N/A; Front Load: 5.50%; Inception Date: April 1, 2010; Manager Names: Frederick(Rick) Schulitz; Daniel Oldroyd; Silvia Trillo.
FP070221_15 copy.png
YTD Return: 7.21%; 3-Yr. Annualized Return: 10.55%; 10-Yr. Annualized Return: 8.23%; 15-Yr. Annualized Return: 6.22%; YTD Net Flow: (millions): ($8.37); 1-Yr. Net Flow (millions): ($28.67); 3-Yr. Net Flow (millions): ($106.48); 5-Yr. Net Flow (millions): ($227.27); 10-Yr. Net Flow (millions): ($550.59); 15-Yr. Net Flow (millions): ($37.95); Inception Date: April 29. 2005; Manager Names: Paul Zemsky; Halvard Kvaale; Barbara Reinhard.
FP070221_14 copy.png
YTD Return: 7.39%; 3-Yr. Annualized Return: 9.66%; 10-Yr. Annualized Return: 9.35%; 15-Yr. Annualized Return: N/A; YTD Net Flow: (millions): 9.25; 1-Yr. Net Flow (millions): $18.34; 3-Yr. Net Flow (millions): $127.63; 5-Yr. Net Flow (millions): $300.11; 10-Yr. Net Flow (millions): N/A; 15-Yr. Net Flow (millions): N/A; Inception Date: Nov. 5. 2007; Manager Names: Joseph R. Gaffoglio; Jamie A. Zendel.
FP070221_13 copy.png
YTD Return: 7.47%; 3-Yr. Annualized Return: 10.58%; 10-Yr. Annualized Return: N/A; 15-Yr. Annualized Return: N/A; YTD Net Flow: (millions): $13.73; 1-Yr. Net Flow (millions): $12.24; 3-Yr. Net Flow (millions): $119.29; 5-Yr. Net Flow (millions): $149.84; 10-Yr. Net Flow (millions): N/A; 15-Yr. Net Flow (millions): N/A; Inception Date: Aug. 24, 2015; Manager Names: Scott W. Smith; Randy L. Welch; James W. Fennessey.
FP070221_12 copy.png
YTD Return: 6.66%; 3-Yr. Annualized Return: 10.82%; 10-Yr. Annualized Return: 9.74%; 15-Yr. Annualized Return: N/A; YTD Net Flow: (millions): $976.29; 1-Yr. Net Flow (millions): $1,995.47; 3-Yr. Net Flow (millions): $7,418.32; 5-Yr. Net Flow (millions): $12,217.18; 10-Yr. Net Flow (millions): $12,217.18; 15-Yr. Net Flow (millions): N/A; Minimum Initial Investment: 250; Inception Date: July 13, 2009; Manager Names: David A. Hoag; Jody F. Jonsson; Wesley K.-S. Phoa; Michelle J. Black; Bradley J. Vogt; Shannon Ward; Samir Mathur.
FP070221_11 copy.png
YTD Return: 6.43%; 3-Yr. Annualized Return: 10.89%; 10-Yr. Annualized Return: 8.89%; 15-Yr. Annualized Return: N/A; YTD Net Flow: (millions): ($14.06); 1-Yr. Net Flow (millions): ($35.76); 3-Yr. Net Flow (millions): ($23.55); 5-Yr. Net Flow (millions): $136.6; 10-Yr. Net Flow (millions): $289.03; 15-Yr. Net Flow (millions): N/A; Inception Date: Sept. 30, 2009; Manager Names: Hans L. Erickson; John Cunniff; Steve Sedmak.
FP070221_10 copy.png
YTD Return: 7.01%; 3-Yr. Annualized Return: 11.02%; 10-Yr. Annualized Return: N/A; 15-Yr. Annualized Return: N/A; YTD Net Flow: (millions): $19.37; 1-Yr. Net Flow (millions): $34.53; 3-Yr. Net Flow (millions): $251.4; 5-Yr. Net Flow (millions): $608.44; 10-Yr. Net Flow (millions): N/A; 15-Yr. Net Flow (millions): N/A; Inception Date: May 1, 2015; Manager Names: Paul Zemsky; Halvard Kvaale; Barbara Reinhard.
FP070221_9 copy.png
YTD Return: 6.26%; 3-Yr. Annualized Return: 10.91%; 10-Yr. Annualized Return: 8.36%; 15-Yr. Annualized Return: N/A; YTD Net Flow: (millions): ($2,029.44); 1-Yr. Net Flow (millions): ($1,408.10); 3-Yr. Net Flow (millions): $337.63; 5-Yr. Net Flow (millions): $760.97; 10-Yr. Net Flow (millions): $1,319.43; 15-Yr. Net Flow (millions): N/A; Inception Date: Oct. 2, 2009; Manager Names: Andrew Dierdorf; Brett F. Sumsion; Finola McGuire Foley.
FP070221_8 copy.png
YTD Return: 6.92%; 3-Yr. Annualized Return: 10.04%; 10-Yr. Annualized Return: 8.88%; 15-Yr. Annualized Return: 6.96%; YTD Net Flow: (millions): ($87.62); 1-Yr. Net Flow (millions): ($142.91); 3-Yr. Net Flow (millions): ($328.96); 5-Yr. Net Flow (millions): ($340.29); 10-Yr. Net Flow (millions): ($324.52); 15-Yr. Net Flow (millions): $265.9; Inception Date: Oct. 15, 2004; Manager Names: Hans L. Erickson; John Cunniff; Steve Sedmak.
FP070221_7 copy.png
YTD Return: 6.64%; 3-Yr. Annualized Return: 10.77%; 10-Yr. Annualized Return: 9.04%; 15-Yr. Annualized Return: 7.47%; YTD Net Flow: (millions): ($6,869.23); 1-Yr. Net Flow (millions): ($8,072.06); 3-Yr. Net Flow (millions): ($8,422.16); 5-Yr. Net Flow (millions): ($4,911.39); 10-Yr. Net Flow (millions): $329.98; 15-Yr. Net Flow (millions): $11,378.75; Minimum Initial Investment: 1,000.00; Inception Date: October 27, 2003; Manager Names: William A. Coleman; Walter Nejman.
FP070221_6 copy.png
YTD Return: 7.58%; 3-Yr. Annualized Return: 10.98%; 10-Yr. Annualized Return: N/A; 15-Yr. Annualized Return: N/A; YTD Net Flow: (millions): $16.05; 1-Yr. Net Flow (millions): $22.37; 3-Yr. Net Flow (millions): ($13.27); 5-Yr. Net Flow (millions): $14.03; 10-Yr. Net Flow (millions): N/A; 15-Yr. Net Flow (millions): N/A; Inception Date: Nov. 11, 2013; Manager Names: Nathan W. Thooft; Robert E. Sykes.
FP070221_5 copy.png
YTD Return: 7.37%; 3-Yr. Annualized Return: 11%; 10-Yr. Annualized Return: 8.45%; 15-Yr. Annualized Return: 6.81%; YTD Net Flow: (millions): ($48.69); 1-Yr. Net Flow (millions): ($127.95); 3-Yr. Net Flow (millions): ($482.34); 5-Yr. Net Flow (millions): ($915.31); 10-Yr. Net Flow (millions): ($1,144.49); 15-Yr. Net Flow (millions): ($159.95); Front Load: 5.75%; Inception Date: Nov. 6, 2003; Manager Names: Andrew Dierdorf; Brett F. Sumsion.
FP070221_4 copy.png
YTD Return: 6.88%; 3-Yr. Annualized Return: 11.61%; 10-Yr. Annualized Return: N/A; 15-Yr. Annualized Return: N/A; YTD Net Flow: (millions): $162.94; 1-Yr. Net Flow (millions): $261.83; 3-Yr. Net Flow (millions): $116.11; 5-Yr. Net Flow (millions): $1,001.58; 10-Yr. Net Flow (millions): N/A; 15-Yr. Net Flow (millions): N/A; Inception Date: Sept. 30, 2014; Manager Names: Charles L. McGinn; Michael Narkiewicz.
FP070221_3 copy.png
YTD Return: 7.76%; 3-Yr. Annualized Return: 11.15%; 10-Yr. Annualized Return: 8.8%; 15-Yr. Annualized Return: 7.14%; YTD Net Flow: (millions): 725.57; 1-Yr. Net Flow (millions): $359.62; 3-Yr. Net Flow (millions): ($1,115.06); 5-Yr. Net Flow (millions): ($345.89); 10-Yr. Net Flow (millions): ($3,962.35); 15-Yr. Net Flow (millions): $2,357.18; Inception Date: Nov. 6, 2003; Manager Names: Andrew Dierdorf; Brett F. Sumsion.
FP070221_2 copy.png
YTD Return: 8.18%; 3-Yr. Annualized Return: 11.64%; 10-Yr. Annualized Return: 9.22%; 15-Yr. Annualized Return: N/A; YTD Net Flow: (millions): ($40.26); 1-Yr. Net Flow (millions): ($123.46); 3-Yr. Net Flow (millions): ($451.5); 5-Yr. Net Flow (millions): ($846.07); 10-Yr. Net Flow (millions): ($791.01); 15-Yr. Net Flow (millions): N/A; Inception Date: Oct. 30, 2006; Manager Names: Nathan W. Thooft; Robert E. Sykes.
FP070221_1 copy.png
YTD Return: 8.62%; 3-Yr. Annualized Return: 11.88%; 10-Yr. Annualized Return: 9.89%; 15-Yr. Annualized Return: 8.09%; YTD Net Flow: (millions): ($745.61); 1-Yr. Net Flow (millions): ($1,878.79); 3-Yr. Net Flow (millions): ($6,333.03); 5-Yr. Net Flow (millions): ($10,060.98); 10-Yr. Net Flow (millions): ($3,679.53); 15-Yr. Net Flow (millions): $567.83; Minimum Initial Investment: 2,500.00; Inception Date: Feb. 27, 2004; Manager Names: Wyatt A. Lee; Kimberly E. DeDominicis; Andrew Jacobs van Merlen.
MORE FROM FINANCIAL PLANNING